 Introduction
to the
Introduction
to theSpectra Experiment
Introduction
to theIn this document we introduce the Spectra experiment from the Physics laboratory at the University of Toronto. It is intended to be used before you begin the experiment. The Preparatory Questions at the end of this document should be answered and turned in to your Demonstrator before you begin to work on the experiment.
![]()
In order to effectively use this page, your browser needs to be capable of viewing Flash animations, also known as swf files. The Flash player is available free from http://www.macromedia.com/. The animations are for Version 5 of the player or later.
A summary of this page are also available below. It is in pdf format. Accessing this document will require that you have the Acrobat Reader, which is available free from http://www.adobe.com
![]()
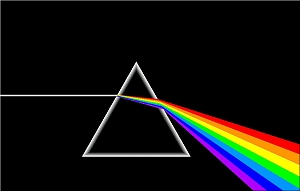
You may know that Newton was the first to prove that white light is made up of all the colors of the rainbow. This "phenomenon of the colors" can be seen by shining a beam of white light through a prism.
| There was resistance to Newton's discovery, since it violated a widely held assumption of the absolute purity of white light. Each color of the rainbow has a unique wavelength; red has longer wavelengths and violet shorter ones. You may also notice the similarity of the figure to the right to the illustration on the box of Reactine, an allergy medication. However, the illustrator for Reactine got the colors backwards, with red at the bottom and purple at the top! |
 |
The light emitted from a pure element has components only at discrete wavelengths, instead of the continuous distribution of wavelengths in the spectrum of white light. This realisation began with the work of Thomas Melvill in 1752, and culminated with Foucault in 1849. The fact that each element has a unique set of wavelengths in its spectrum meant that by the late 1800's spectroscopy was used to identify elements in a sample. You may learn more about the history of spectroscopy at http://www.phys.virginia.edu/CLASSES/252/spectra.html The figure to the right shows some "line spectra" from pure elements. You will wish to know that although the Sodium spectrum shown at the top of the figure to the right appears to be a single yellow line, it in fact is two lines of almost the same wavelength (588.9950 and 589.5924 nm). There are also faint lines in the Sodium spectrum at other wavelengths, which you will see in the experiment. |
 |
In the experiment, you will:
![]()
The photograph to the right shows the spectrometer. The slit is pointed at the light source. The width of the slit is adjustable with the metal ring around it. The eyepiece is adjusted for a good focus of the slit. Then the position of the eyepiece is moved back and forth with the adjustment, and its position is read with the vernier scale. |
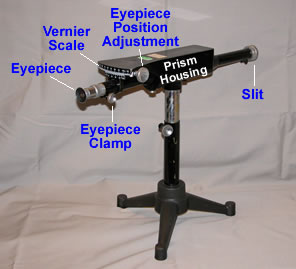 |
From the photograph of the apparatus, you can see that the maximum angle between the incoming light and the eyepiece is only 25 degrees or so. But the first figure above indicates, correctly, that the deviation of light by a single prism is much more than this. Our spectrometers use a tri-prism arrangement to reduce the overall angle, making the spectrometer much easier to use.
|
Objects A and C are made of the same type of glass. Prism B is made of a glass with a higher index of refraction than either A or C; this prism does most of the dispersion of the light.
Our spectrometers are model JS, manufactured by Canadian Arsenals Ltd. We are not sure when they were made, perhaps as long ago as the 1940's. The spectrometer is capable of resolving to about 0.1 nm (1 Å).
As the knob on the side of the body of the spectrometer is rotated, the eyepiece moves and you will see different parts of the spectrum. The figure to the right simulates what you might see. Note that the "cross hairs" in the eyepiece are aligned to form an x instead of a +. This alignment will give the most precise result in determining the scale position for a given spectral line. |
In order to use the spectrometer you will need to know how to read a vernier scale. A document is available by clicking on the green button to the right. It will appear in a separate window, and has a file size of 56k. You should have your browser enabled for Java to effectively use this introduction. |
|
The vernier scale on the spectrometer has a small extension to the simple verniers discussed in the above document.
 |
|||
In the above diagram the "pointer" of the vernier, the line labeled with 0, lines up almost exactly with the 16th division of the scale. The units of the scale are arbitrary so the reading is 16.00 units. However, notice that the vernier goes from 0 to 50 instead of 0 to 100. |
|||
 |
|||
Now the pointer is between 16.00 and 16.50 units. The 15 line on the vernier lines up almost exactly with a line on the scale, so the reading is 16.00 + 0.15 = 16.15 units. |
|||
 |
|||
Now the pointer is between 16.50 and 17.00 units, and again the 15 line on the vernier lines up almost exactly with a line on the scale. So in this case the reading is 16.50 + 0.15 = 16.65 units. |
|||
|
![]()
You can focus the eyepiece by using an incandescent light source and moving the eyepiece in and out until the cross hairs are as sharp as possible.
Above we stated that the yellow line that gives Sodium its characteristic color is in fact two lines that differ by about 0.6 nm. You will use the Sodium lamp to adjust the width of the slit so that those two lines are resolved. If the slit is too wide you will only see one line, and if the slit is too narrow you will find it difficult to see the lines in the spectra at all.
The metal ring around the slit is rotated to adjust the width. Here is a simulation of adjusting the slit to resolve the Sodium doublet.
![]()
Calibrating the spectrometer means determining the relationship between the wavelength of a spectral line and the scale reading on the spectrometer. Once this relationship is established you can use it to convert the scale reading of an unknown line to the corresponding wavelength. The precision of your calibration curve determines the quality of everything you do subsequently.
Helium is a good choice for calibrating the spectrometer because it has a number of easily seen lines spread over a wide range of wavelengths. Here is the Helium spectrum:

The wavelengths and intensities of the lines of the spectrum are given in the Summary of this document.
The relationship between the scale reading y and the
wavelength ![]() is given by the
Hartmann Dispersion Relation:
is given by the
Hartmann Dispersion Relation:
 |
(1) |
Thus a plot of y versus 1/(![]() -
- ![]() 0) will be a
straight line.
0) will be a
straight line. ![]() 0
is a constant for each spectrometer, whose value is marked on the body. Thus,
when you have collected data on scale readings versus wavelengths for the Helium
spectrum you may fit it to a straight line.
0
is a constant for each spectrometer, whose value is marked on the body. Thus,
when you have collected data on scale readings versus wavelengths for the Helium
spectrum you may fit it to a straight line.
Note that Equation 1 means that a simple plot of ![]() versus y will be a hyperbola. In principle such a plot could be used
for the calibration, but it will not be as accurate as using Equation 1.
versus y will be a hyperbola. In principle such a plot could be used
for the calibration, but it will not be as accurate as using Equation 1.
The bright yellow line in the Helium spectrum was observed in the spectrum from the Sun by Lockyer in 1868. At that time the existence of Helium was not known, and Lockyer realised that the wavelength of the yellow line did not correspond to the spectra of any known elements. Thus, Lockyer discovered Helium.
![]()
The Hydrogen spectrum shown above seems to exhibit some sort of regularity in the wavelengths of the lines. Balmer was a schoolteacher whose hobby was numerology. He had a friend who was a chemist, who in 1885 suggested that he try to find some formula for the Hydrogen spectrum. He found the wavelengths of the visible lines could be described by a simple equation:
 |
, n = 3,4,5,... | (2) |
RH is called the Rydberg constant.
The line corresponding to n = 3 is red. The higher values are lines for shorter wavelengths, towards the violet end of the spectrum.
Measure the wavelengths of the bright lines in the Hydrogen spectrum and determine the Rydberg constant. Since you are directly measuring the scale position y to find the wavelength, you will find it convenient to re-arrange Equation 1 into:
(3) |
There are some faint bands of light in the spectrum that arise because Hydrogen is a molecule. Ignore them for this part of the experiment.
As mentioned earlier, as an experimental tool optical spectroscopy was fully developed by the end of the 19th century. Theoretical physics did not begin to understand why pure elements have unique line spectra and what the wavelengths were until after the discovery of Quantum Mechanics in 1925. Theoretical physics such as Quantum Mechanics is what you study in the lecture component of your physics courses. In the laboratory we study experimental physics.
![]()
The Rydberg constant RH was first evaluated by Balmer in 1885.
Calculate h * c * RH, where h is Planck's constant and c is the speed of light. The product has units of energy.
Convert your result to the energy unit of electron-volts (eV). Compare to the ionisation energy of a single Hydrogen atom in its ground state, which is 13.6 eV.
Does your result have anything to do with the Equation given in Preparatory Question 4 below? How?
![]()
You can now test your skill as a spectroscopist by measuring the wavelengths of the spectral lines of "unknown" substances contained in the spectral tubes placed near the various spectrometers. Identify at least one unknown.
The Summary of this document lists the wavelengths and intensities of the spectra of many common substances. There are also various coloured spectral charts around the walls of the lab. Also, the colour of the light given off by the light source often gives a hint to the gas contained.
![]()
We hope that the following questions will guide you in your preparation for the experiment you are about to perform. They are not meant to be particularly testing, nor do they contain any "tricks". Once you have answered them, you should be in a good position to begin the experiment.

![]()
A summary of the material in the above document has been prepared. It also contains tables of the wavelengths and intensities of many common elements, which will be required for calibrating the spectrometer and identifying unknowns. It is in pdf format and may be printed it you wish. To access the summary click on the red button to the right. The file size is 52k, and it will appear in a separate window. |
![]()
This Guide Sheet is based on earlier versions by David M. Harrison, Tony Key, Joe Vise and others.
This web version is by David M. Harrison, April 2003. The is $Revision: 0.3 $, $Date: 2003/04/16 15:54:12 $ (y/m/d/ UTC).