Prepared by David Harrison - April 2004
Ruxandra recently surveyed students in our PHY110Y/PHY138Y Laboratory about their opinions regarding the lab. This document summarises the results.
617 students participated, which is 51% of the students enrolled in the laboratory.
In general the students were more positive about the laboratory than last year.
Major changes from last year's laboratory include:
My opinion is that the reduction in group sizes is the most significant factor in the overall increase in student satisfaction with the lab.
Below it can be seen that the most dramatic improvement is on the students' rating of their Demonstrator. This is probably related to the smaller groups plus the Demonstrator's increased language proficiency and training. (Note that improvement in all questions means a lower number.)
In the table below, the uncertainties are the standard error of the mean, ![]() , i.e. the standard deviation divided by the square root of the number of responses. Blank answers are ignored. The numbers in parentheses were the responses to the same question in last year's evaluation.
, i.e. the standard deviation divided by the square root of the number of responses. Blank answers are ignored. The numbers in parentheses were the responses to the same question in last year's evaluation.
| Question | Mean ± |
|||||
|---|---|---|---|---|---|---|
Everything considered, give an overall rating of the
lab by choosing one of the following:
Comment: below we compare this result to previous years in more detail. |
2.87 ± 0.05 (3.29 ± 0.05) 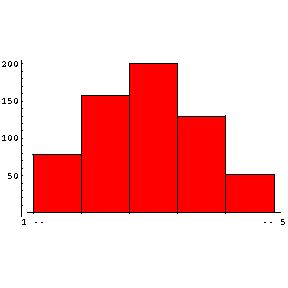 |
|||||
Please compare the Physics lab with other labs you are
taking:
|
2.95 ± 0.05 ( 3.63 ± 0.04)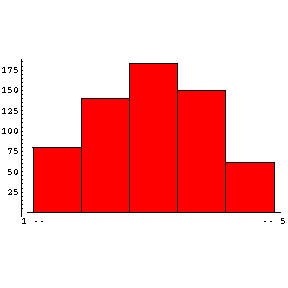 |
|||||
Are you learning enough from the lab?
|
2.43 ± 0.04 (2.87 ± 0.04)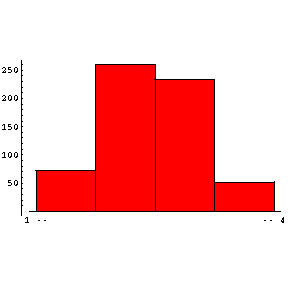 |
|||||
Does the lab demand too much time from you?
Comment: perfect! |
2.64 ± 0.04 (2.77 ± 0.04)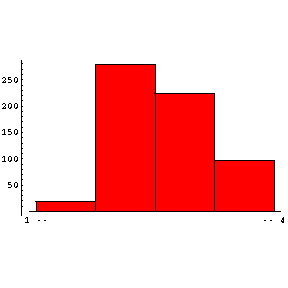 |
|||||
Do you get adequate and prompt feedback on the quality
of your work?
|
2.29 ± 0.04 (2.57 ± 0.04)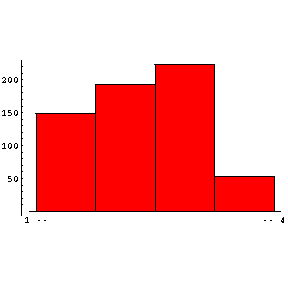 |
|||||
Do the marks you have received reflect the quality of
your work in the lab? In your opinion the marks you have been given are:
Comment: this is the only item where student satisfaction is less than last year. |
3.71 ± 0.03 (3.59 ± 0.02)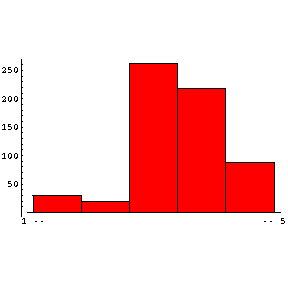 |
|||||
Please rate your demonstrator in terms of his/her
teaching ability and help provided:
Comment: as mentioned above, this item shows the largest increase in student satisfaction compared to last year. |
2.59 ± 0.04 (3.51 ± 0.02)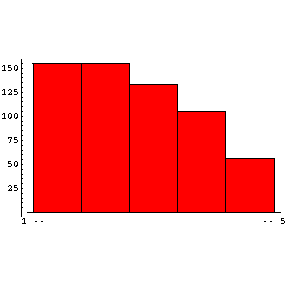 |
|||||
The Guide Sheets for some Core experiments are new, using multimedia, Flash and videos. Other older Guides are only in hardcopy in the lab manual. If you have used both types for Core experiments, please rate the new multimedia Guides as compared with the older Guides:
|
2.41 ± 0.04 (NA) 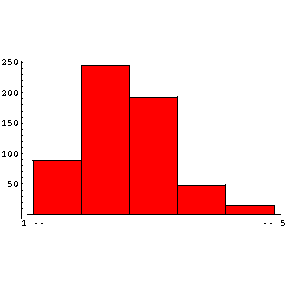 |
Here we compare the overall rating of the laboratory this year to previous years. The numbers assume that the uncertainty in the number of responses is the square root of the number.
| Physics Course | This Year | Spring 2003 | Spring 2002 | Spring 2001 | Spring 1998 |
|---|---|---|---|---|---|
| PHY110Y | 71.0 ± 8.1% | 55.3 ± 7.7% | 62.3 ± 9.0% | 77.7 ± 9.1% | 55% |
| PHY138Y | 70.6 ± 3.7% | 60.9 ± 4.1% | 70.6 ± 3.9% | 83.9 ± 4.7% | 74% |
For the first time PHY110 students are at least as satisfied with the lab as PHY138 students.
The satisfaction with the laboratory is still far from the results reported in the Spring of 2001. Why that year's results were so positive is unknown. However, this was the first year in which the laboratory did not have students from PHY140 or PHY180, who that year moved to their own lab. It is also the year that I returned to the laboratory after an absence of some years.
PHY138 students could have taken Grade 12 Physics, OAC Physics, or, if they did not graduate from an Ontario High School, some other high school Physics course. In another document we saw that students who graduated from High School in 2003 with an OAC Physics course were doing somewhat worse than Grade 12 Physics students in their first term lab marks. Here we compare the evaluations of the 3 types of PHY138 students. The current and previous Physics courses are as reported by the students.
The question on student background that was asked was:
|
In high school, what is the highest level of physics course that you took ?
|
||||
|
| Physics Background |
Percentage
|
|---|---|
|
OAC Physics
|
66.8 ± 5.6%
|
|
Grade 12 Physics
|
72.3 ± 5.2%
|
|
Other
|
83. ± 19.%
|
Clearly the Grade 12 students are much happier with the lab than OAC ones. The small number of "Other" students (19 out of 23) means the percentage shown is statistically insignificant.
Not summarised above is another question from the survey:
| What was the most difficult part of the physics labs? Please rate by circling one or several of the following: | |||
|
| What | Number | Percentage |
|---|---|---|
|
Experimental only
|
94
|
15 ± 2%
|
|
Experimental and another part
|
29
|
5 ± 1%
|
|
Theoretical only
|
155
|
25 ± 2%
|
|
Theoretical plus another part
|
40
|
6 ± 1%
|
|
Analysis only
|
302
|
49 ± 3%
|
|
Analysis plus another part
|
46
|
7 ± 1%
|
|
Students who do not know the meaning of "most" and answered all three choices
|
9
|
1.5 ± 0.5%
|
Ruxandra noticed that the correlation between the overall rating of the laboratory and the comparison of this laboratory to other labs the students are taking is not perfect. Here we examine this a little more carefully.
|
The overall rating of the laboratory and the comparison to other labs, from 2 different viewpoints |
||
|
From the above histograms, we see that the correlation of answers to these 2 questions is strong but not 100%. The largest number of off-diagonal entries is students whose comparative ranking of this laboratory is worse than their overall ranking of this laboratory. For example, one student rated this laboratory as Excellent but Much Worse than other labs; this datum is located at the far left-hand corner of the histograms.
The following histogram expands the vertical scale.
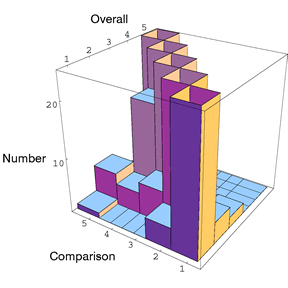 |
The largest off-diagonal term is an overall rating of Fair for the laboratory and that it is Worse than other labs the students are taking.