Ruxandra and I have recently surveyed students in our PHY110Y/PHY138Y Laboratory about their opinions regarding the lab. This document summarises the results.
549 students participated, which is 60% of the students enrolled in the laboratory.
In the tables below, the numbers in parentheses were the responses to the same question in last year's evaluation. In general, students this year were less positive about the lab than last year. There were two major changes in the laboratory for this year:
We believe that the issue of Demonstrator complement for this laboratory has reached a state of crisis, and is probably why the students tended to choose the more negative answers to all the questions in the survey. The students' increased grumpiness is even reflected in their responses to "neutral" questions like:
Do you think the free choice of experiments in the second term is a better educational program than the lock-step that you had in the first term?
The mean on this question increased from 1.82 to 2.01, with larger numbers more negative.
It is interesting to note that the largest increase in negative responses was the overall rating of the Demonstrators: the mean went from 2.50 to 2.93. This is consistent with the large group sizes influencing the results of this evaluation.
![]()
| Question | Mean ± Standard Deviation | |||||
|---|---|---|---|---|---|---|
Everything considered, give an overall rating of the
lab by choosing one of the following:
Comment: below we compare this result to previous years. |
3.08 ± 0.97 (2.73 ± 0.86)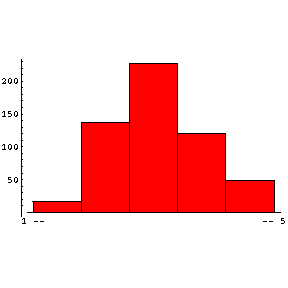 |
|||||
Please compare the Physics lab with other labs you are
taking:
Comment: this result is disappointing |
3.36 ± 0.98 (3.0 ± 1.1)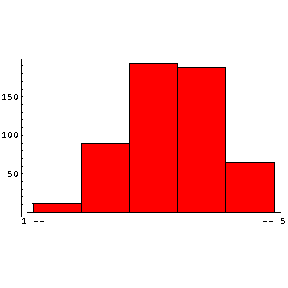 |
|||||
Are you learning enough from the lab?
|
2.80 ± 0.79 (2.52 ± 0.75) 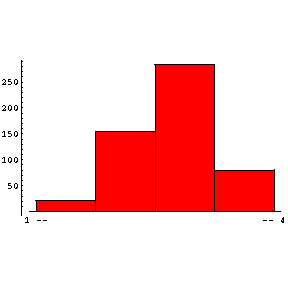 |
|||||
Do you think the free choice of experiments in the
second term is a better educational program than the lock-step that you had in
the first term?
|
2.01 ± 0.96 (1.82 ± 0.83)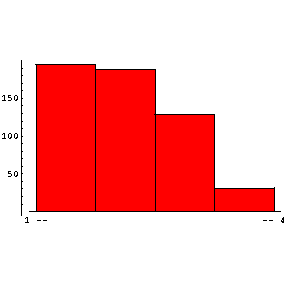 |
|||||
Does the lab demand too much time from you?
Comment: perfect! |
2.43 ± 0.74 (2.39 ± 0.72)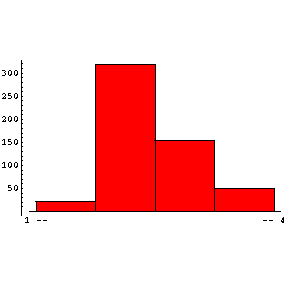 |
|||||
Do you get adequate and prompt feedback on the quality
of your work?
|
2.53 ± 0.93 (2.21 ± 0.99)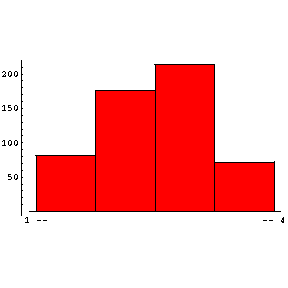 |
|||||
Do the marks you have received reflect the quality of
your work in the lab? In your opinion the marks you have been given are:
Comment: almost perfect! |
3.59 ± 0.71 (3.41 ± 0.70)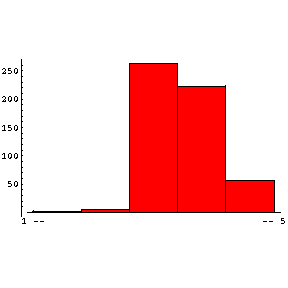 |
|||||
Please rate your demonstrator in terms of his/her
teaching ability and help provided:
|
2.93 ± 1.27 (2.5 ± 1.2)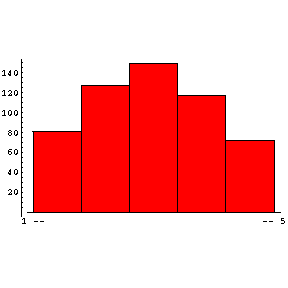 |
|||||
At the beginning of the year you read a series of
web-documents on Error Analysis, did some computer exercises, and answered some
questions on this topic. As an aid to your learning, this material was:
|
3.04 ± 1.10 (Not asked last year)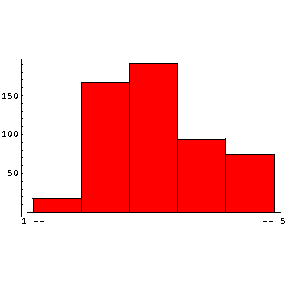 |
Here is a comparison of the overall rating of the laboratory this year and in two previous years:
| Physics Course | This Year | Spring 2001 | Spring 1998 |
|---|---|---|---|
| PHY110Y | (62.3 ± 9.0)% | (77.7 ± 9.1)% | 55% |
| PHY138Y | (70.6 ± 3.9)% | (83.9 ± 4.7)% | 74% |
In the above table, the errors assume that the uncertainty in the number of responses is the square root of the number.
![]()
In addition to the multiple choice questions summarised above, we asked the students two related questions:
Virtually every experiment in the laboratory appeared as answers to both questions. In all, the laboratory has 46 different experiments: 36 of these were ranked as the "best" and 32 were ranked as the "worst" by at least one student.
We shall summarise the Core experiments first, which many more students have done, and then the Non-Core ones which are done by fewer students.
For the Core experiments, we only report on ones that have 10 or more "votes" as either the best or the worst experiment. The figures in parentheses are from last year's evaluation.
The Score in the final column is:
Score = ( N[best] - N[worst] ) / ( N[best] + N[worst] )
where we assume that the error in the number of "votes" is the square root of the number. Positive numbers are good, and negative ones are bad.
| Experiment | Number Saying it Was the Best | Number Saying it Was the Worst | Score |
|---|---|---|---|
| Free Fall | 97 (94) | 26 (29) | 0.58 ± 0.07 (0.53 ± 0.08) |
| Air Track | 17 (5) | 5 (14) | 0.55 ± 0.18 (-0.47 ± 0.20) |
| Heat Capacity | 19 (17) | 7 (25) | 0.46 ± 0.17 (-0.19 ± 0.15) |
| Absolute Zero | 20 (24) | 15 (25) | 0.14 ± 0.17 (-0.02 ± 0.14) |
| DC Circuits I | 63 (46) | 53 (49) | 0.09 ± 0.09 (-0.02 ± 0.10) |
| Velocity of Sound in a Pure Gas | 18 (9) | 24 (15) | -0.14 ± 0.15 (-0.25 ± 0.20) |
| Lens Optics | 25 (26) | 35 (38) | -0.17 ± 0.13 (-0.19 ± 0.12) |
| Boyle's Law | 28 (31) | 41 (43) | -0.19 ± 0.12 (-0.15 ± 0.11) |
| Spectra | 28 (34) | 47 (44) | -0.25 ± 0.11 (-0.13 ± 0.11) |
| Thermal Expansion | 19 (41) | 32 (22) | -0.25 ± 0.14 (0.30 ± 0.12) |
| Vapor Pressure | 4 (6) | 14 (6) | -0.56 ± 0.20 (0.00 ± 0.29) |
| Speed of Sound in a Solid | 7 (11) | 28 (18) | -0.60 ± 0.14 (-0.24 ± 0.18) |
| Standing Waves | 3 (2) | 30 (35) | -0.82 ± 0.10 (-0.89 ± 0.07) |
Last year's evaluation indicated dissatisfaction with the Standing Waves experiment, which was substantially revised for this year. Our efforts were clearly under-whelming. We also heavily revised the Air Track experiment, and this work seems to have actually helped the experiment.
For the Non-Core experiments, we only include ones that have 5 or more votes as best or worst.
| Experiment | Number Saying it Was the Best | Number Saying it Was the Worst |
|---|---|---|
| Air Table | 8 (NA) | 0 (NA) |
| Electrocardiogram | 7 (NA) | 0 (NA) |
| Optical Activity | 6 (NA) | 1 (NA) |
| Surface Tension | 6 (11) | 4 (8) |
| Gyroscope | 0 (NA) | 8 (NA) |
![]()
Above we suggested that the very large group sizes in our laboratory influenced the students' responses to this evaluation. A fascinating study has recently been published that shows just how fickle evaluation responses can be. In the study, first year students at Duke were asked to fill out an evaluation of the course both before and after they received their marks in the course. One of the questions asked the students what grade they expected to get.
Not surprisingly, students who expected a higher mark tended to provide more favorable reviews.
However, in the post-course evaluation students who did not receive as good a mark as they had expected significantly lowered their evaluation, while those who received higher marks than they had expected raised theirs. Note that these were the same students rating the same professors in the same courses.
The full article describing the above study, and more, appeared in the New York Times Education Life supplement of April 14, 2002. The article is available on-line but requires a registration with the Times, which is free. The URL of the article is: http://www.nytimes.com/2002/04/14/edlife/14ED-VIEW.html.