May 6, 2002
Prepared by David Harrison
As is customary, this report summarises the usage of the undergraduate computing facility in the past academic year.
UPSCALE services can be divided into three main categories:
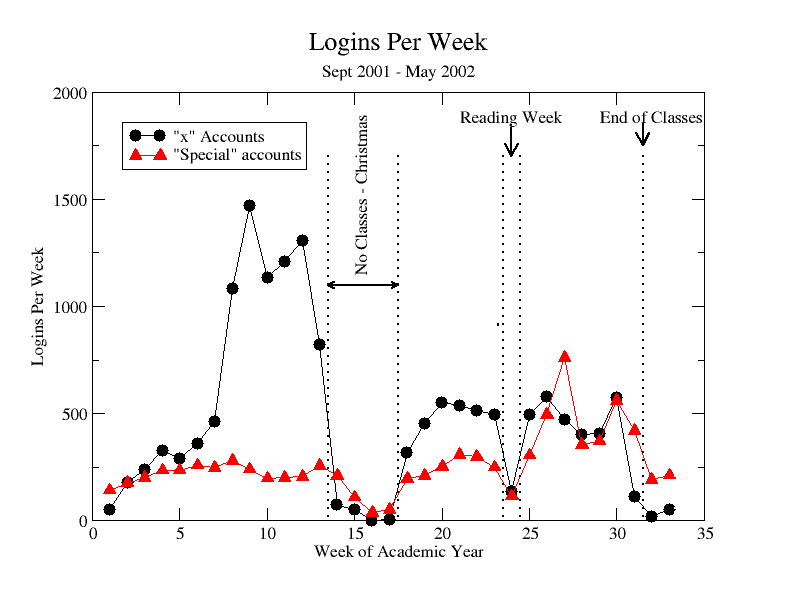
UPSCALE maintains two types of accounts for undergraduate students, offering somewhat different services. The "x" accounts are given to our first and second year students. The "special" accounts are for upper-year students.
Traditional logins are either from our in-house X-terminals or remotely via ssh, ftp or telnet. These are summarised in this section.
The following figure shows the logins per week for the "x" accounts and "special" accounts.
Other aspects of this service are summarised in the following table.
| What | 2001-2002 | 2000-2001 | 1999-2000 | 1998-99 | 1997-98 |
| Active "x" accounts | 1533 | 1424 | 1794 | 1940 | 1792 |
| Active "special" accounts | 109 | 84 | 86 | 116 | 117 |
| Total student accounts | 1642 | 1508 | 1880 | 2056 | 1909 |
| Number of "x" logins | 15,222 | 13,488 | 18,820 | 21,499 | 22,576 |
| Number of "special" logins | 9067 | 6329 | 5119 | 5687 | 12,341 |
| Total logins | 24,289 | 19,817 | 23.939 | 27,186 | 34,917 |
| "x" connect hours | 6373 | 6784 | 8465.8 | 10,246 | 9436 |
| "special" connect hours | 2290 | 2110 | 1772.6 | 1492 | 2725 |
| Total connect hours | 8663 | 8894 | 10,238.4 | 11,738 | 11,861 |
In the following table, the phrase "top-level accesses" means access to the html "home page" for a particular sub-system. Certainly some students have bookmarked pages that are accessed by these "home pages" and jumping directly to these pages is not "top-level".
| What | 2001-2002 | 2000-2001 | 1999-2000 | 1998-99 | 1997-98 | 1996-97 |
| Html and pdf files delivered | 1,620,413 | 1,194,853 | 1,075,740 | 591,164 | NA | NA |
| Files delivered | 5,470,331 | 3,759,035 | 2,938,049 | 1,599,770 | 834,568 | 482,046 |
| Percentage delivered in-house | 8.5% | 12.6% | 11.4% | 3.0% | 7.4% | 36.9% |
| Total Gigabytes delivered | 74.1 | 36.3 | 28.3 | NA | NA | NA |
| UPSCALE top-level accesses | 45,776 | NA | NA | NA | NA | NA |
| PHY138Y top-level accesses | 41,345 | 46,786 | 47,486 | 25,579 | NA | NA |
| JPU200Y top-level accesses | 4472 | 3909 | 3004 | 1806 | NA | NA |
| PHY110/138 Lab top-level accesses | 6547 | 5119 | 6822 | NA | NA | NA |
| I Year Laboratory non-core Guide Sheets. | 79,467 | 38,533 | 3943 | |||
| Fits and graphs performed | 73,091 | 77,657 | 45,870 | |||
| Physics Virtual Bookshelf top-level accesses | 9189 | 5573 | 2187 | 659 |
In the above, entries marked NA are data that are not available. Blank entries mean that the service being summarised was not part of our web site for those years. Also, the "Percentage delivered in-house" only means via our X-terminals, not via a browser on one of our PCs.
The following figure shows the Gigabytes per day delivered by our web server.
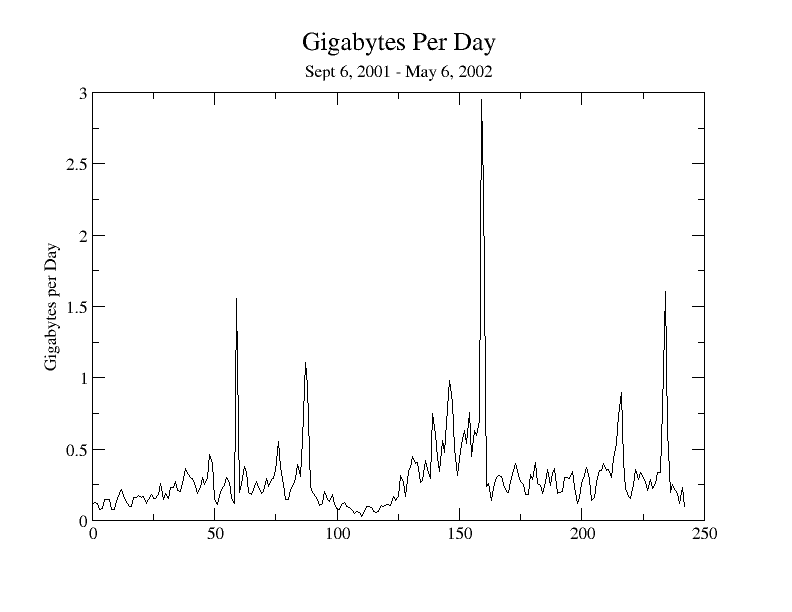
Most of the peaks in the above figure correspond to tests and exams in our large courses. For example the peak at day 235 (April 28, 2002) was just before the Final Exam in PHY138 on April 29.
The large peak at days 160 and 161 (February 12 and 13, 2002) we are not sure about. Perhaps somebody tried a denial of service attack on our server. We were unaware of this anamoly until we summarised the logs on March 12.
We have been providing file and print services to the PC's in the Nortel laboratory for a number of years, although monitoring this usage was difficult until a server upgrade in December 1999. We also provide similar services to the Physics Specialist Laboratory.
| Service | 2001-2002 | 2000-2001 | Spring Term, 2000 |
|---|---|---|---|
| Connections by "x" accounts | 2834 | 2427 | NA |
| Connections by "special" accounts | 3247 | 3587 | NA |
| Total connections | 6081 | 6014 | 4838 |
| Print jobs through the server | 4123 | 3712 | 750 |