 A lack of understanding of basic error analysis has led
some very bright scientists to make some incredible blunders. Here we give only
three examples of many.
A lack of understanding of basic error analysis has led
some very bright scientists to make some incredible blunders. Here we give only
three examples of many.A lack of understanding of basic error analysis has led
some very bright scientists to make some incredible blunders. Here we give only
three examples of many.
In 1989 two University of Utah researchers, Stanley Pons and Martin Fleischmann, announced that they had produced nuclear fusion with a laboratory bench apparatus consisting of palladium rods immersed in a bath of deuterium, or heavy water. The scientists said their device emitted neutrons and gamma rays, which are certain signatures of nuclear, as opposed to chemical, reactions.
This announcement caused a huge reaction in the popular press, and there were many statements being made that this was the beginning of unlimited free energy for the world.
The claim turned out to be wrong: cold fusion in this form does not exist. Amongst other mistakes, Pons and Fleischman neglected to do the simple error analysis on their results which would have shown that they had not achieved cold fusion in their lab.
You may learn more about this sad episode in the history of Physics by clicking here.
In the early 1970's researchers reported that a diet that was high in fiber reduced the incidence of polyps forming in the colon. These polyps are a pre-cursor to cancer.
As a consequence of these studies, many people have since been eating as much fiber as they could possibly get down their gullet.
In January 2000 a massive study published in the New England Journal of Medicine indicated that fiber in the diet has no effect on the incidence of polyps.
The problem with the earlier studies is that the limited number of people in the samples meant that the results were statistically insignificant. Put another way, the error bars of the measurements were so large that the 2 samples, with and without high fiber diets, gave cancer rates that were numerically different but were the same within errors.
Note the word statistically in the previous paragraph: it indicates correctly that some knowledge of statistics will be necessary in our study of error analysis.
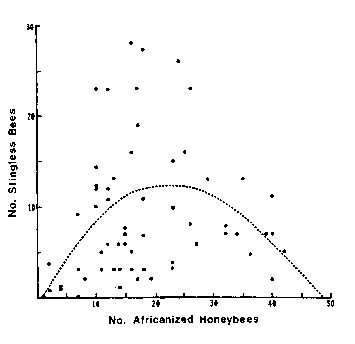
Two of the very highest prestige scientific journals in the world are Nature and Science. Here is a figure and caption from an article published by David W. Roubik in Science 201 (1978), 1030.
|
| It seems fairly clear that this "best fit to the points" in fact has no relationship whatsoever to what the data actually look like. In fact, some think the data look more like a duck, with the beak in the upper-left and pointing to the left. You may access a little Flash animation about this I put together on a quiet afternoon by clicking on the button to the right; it will appear in a separate window and has a file size of 17k. |
|
The purpose to this series of documents and exercises on error analysis is to keep you from making these kinds of blunders in your own work, either as a student or in later life. |
![]()
![]()
This document is Copyright © 2001, 2004 David M. Harrison
 |
This work is licensed under a Creative Commons License. |
This is $Revision: 1.5 $, $Date: 2004/07/18 16:43:33 $ (year/month/day) UTC.