
In most of what has gone before we have been discussing errors of precision. Here we discuss errors of accuracy which, as mentioned in Section 7, are not the same thing.
For example, imagine that we are measuring a time with a high quality pendulum clock. We calculate the estimated mean of a number of repeated measurements and its error of precision using the techniques discussed in the previous sections. However if the weight at the end of the pendulum is set at the wrong position, all the measurements will by systematically either too high or too low. This type of error is called a systematic error. It is an error of accuracy.
Exercise 12.1. Measure some length using different rulers and/or meter sticks made by different manufacturers. Compare the results of the different measurements.
For many laboratory instruments, the manufacturer provides the claimed accuracy. For example, the specifications for a Philips 2400/02 analog multimeter may be found at http://www.upscale.utoronto.ca/specs/pm2400.html. In that document the accuracy of DC voltage measurements is given as ± 3% of whatever scale is being used.
What this specification means is that the manufacturer claims that a particular PM2400/02 voltmeter may read a voltage that is too high or too low, but the reading will be within 3% times the scale of the "true" value of the voltage.
Note that, as opposed to errors of precision, repeating the measurement does no good in increasing the accuracy of the measurement: the meter will still read too high or too low by the same amount each time.
For a particular experiment, usually one of the error of precision or the error of accuracy will dominate, and we ignore the smaller of the two.
For example, if one is measuring the height of a sample of geraniums, the standard deviation discussed in Sections 4 and 5 is probably much larger than the error of accuracy of the ruler being used. Thus the error of precision is greater than the error of accuracy. In this case, in principle we could reduce this error by increasing the number of geraniums in our sample.
On the other hand, in titrating a sample of HCl acid with NaOH base using a phenolphthalein indicator, the major error in the determination of the original concentration of the acid is likely to be one or more of the following: (1) the accuracy of the markings on the side of the burette; (2) the transition range of the phenolphthalein indicator; or (3) the skill of the experimenter in splitting the last drop of NaOH. Thus, the accuracy of the determination is likely to be much worse than the precision.
Question 12.1. Most experiments use theoretical formulas, and often those formulas are approximations. Is the error of approximation one of precision or of accuracy?
To increase the accuracy of a measurement with some instrument, we can calibrate it. Here is an example.
We measure a DC voltage to be 6.50 V using the PM2400/02 meter discussed above. We used the 10 V scale to do the measurement, so the error of accuracy is 3% × 10 V, or ± 0.3 V. We estimate the reading error to be 0.03 V, which is negligible compared to the error of accuracy. Repeating the measurements gives the same result of 6.50 V.
We decide to calibrate the meter using a more accurate Fluke 8000A digital multimeter. Since we are calibrating the Philips instrument we are not interested in its accuracy, and will use the reading error of 0.03 V as the error in each measurement. The accuracy of the Fluke instrument, as given here, is 0.1% of the reading + 1 digit. Here are the results of the calibration:
| Philips (V ± 0.03 V Reading Error) | Fluke (V) | Accuracy of Fluke Measurement (V) |
|---|---|---|
| 3.04 | 3.18 | 0.01 |
| 5.02 | 5.13 | 0.02 |
| 7.63 | 7.75 | 0.02 |
| 9.53 | 9.61 | 0.02 |
As a digital instrument, the reading error of the Fluke meter is 0.005 V, which is negligible compared with its accuracy. We also note that all of the readings by the Philips instrument are well within its claimed accuracy of 0.3 V.
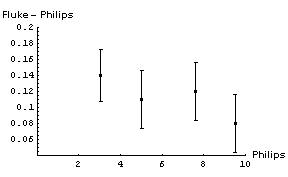
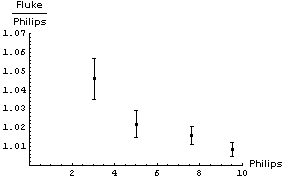
It is not immediately obvious whether the correction factor to be applied to the Philips readings should be an addition of some number or a multiplication by some factor. We will examine both by:
In both cases we will propagate the errors in quadrature. Here are graphs of the results:
|
|
|
|
In appears that adding a constant factor to the Philips readings is a reasonable thing to do. The figure to the right shows the Fluke - Philips readings again but with the result of fitting the data to a straight line added. The fit program determined the intercept of the line to be 0.160 ± 0.046 V and the slope to be -0.0075 ± 0.0069. |
|
Thus when we read 6.50 V on the Philips meter we should add a correction factor of :
(0.160 ± 0.046) + (-0.0075 ± 0.0069) × 6.50 = 0.11 ± 0.07V
So the final calibrated result when we read a voltage of 6.50 V on the Philips meter is 6.61 ± 0.07 V. Note that this is much better than the accuracy of the Philips meter, which is ± 0.3 V.
You may wish to know that all of the above numbers are real data, and when the Philips instrument read 6.50 V the Fluke meter measured the same voltage to be 6.63 ± 0.02 V
We conclude this section with some general observations.
First, there are a few companies who have the sales department write their specifications instead of the engineering department. And even reputable companies like Philips and Fluke can not account for the fact that maybe somebody dropped the instrument and broke it.
The calibration discussed above is time consuming, and in the real would only be done if you are going to be using the Philips instrument a lot. If you are only doing one or two measurements and need better accuracy than it supplies, use the better meter instead.
In the calibration, we were combining errors of accuracy using quadrature, although Section 9 clearly states that the rules there are for errors of precision. In Section 11 we justified those rules because we don't know whether a given measurement is higher or lower than the "true" value. That justification means that quadrature was probably the reasonable thing to do in the calibration.
Sometimes we don't care about the accuracy. This is always the case when it is better than the precision of the measurement, but can be true in other cases too. For example, we know that for a current I flowing through a resistor of resistance R, the voltage V across the resistor is given by Ohm's Law:
V = I R
Imagine that to determine the resistance of particular resistor you take data of the voltage for a number of different currents and plot V versus I. The slope of a straight line through the origin and the data will be the resistance R.
If you were doing all the voltage measurements on the 10 volt scale using the Philips meter, its error of accuracy is 0.3 V. This means that all the readings can read, say, 0.3 volts too high. If all the readings are too high or too low by the same amount, this has no effect on the slope and therefore no effect on your determination of the resistance.
This is essentially the situation for Philips meter we have been discussing, the meter almost always read too low by 0.160 V. Put another way, the slope of the fitted calibration line (-0.0075 ± 0.0069) is almost zero with errors.
Question 12.2. Above we said that in determining the resistance, the line should go through the origin as well as the data points. Why? What does it mean physically if the line does not go through the origin?
Question 12.3. How would you calibrate the rulers and/or meter sticks you used in Exercise 12.1?
This document is Copyright © 2001, 2004 David M. Harrison
 |
This work is licensed under a Creative Commons License. |
This is $Revision: 1.8 $, $Date: 2004/07/31 11:38:16 $ (year/month/day) UTC.