We have surveyed PHY138 students about some of the teaching techniques that we have been using this year. We surveyed the students twice, with almost identical questions both times. The first survey was during the sixth week of classes (Oct. 20 - 22), and the second was during the twenty-first week of classes (March 9 - 11). The survey was conducted in tutorials.
I will not discuss the results in any detail: they mostly speak for themselves.
| A pdf of the first survey form is available via the button to the right. Below we indicate changes in the survey form that was used in March. |
669 students responded to the first survey; this was about 67% of the class.
311 students responded to the second survey; this is about 35% of currently enrolled students.
The answer to each question is a number between 1 and 7, with higher numbers positive; neutral is 4. The Summary column was calculated as follows:
| When | Mean | Summary | Comment | |||||||||
|---|---|---|---|---|---|---|---|---|---|---|---|---|
| In-Class Questions |
|
|||||||||||
| Small-Group Discussion in Class |
|
|||||||||||
| Demonstrations |
|
|||||||||||
| Flash Animations |
|
|||||||||||
| Pre-Class Quizzes |
|
|||||||||||
| MP Problem Sets |
|
|||||||||||
| Written Homework |
|
|||||||||||
| McDermott Tutorials |
|
|||||||||||
| Tablet PC |
|
|||||||||||
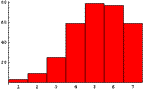
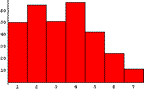
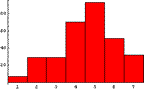
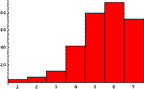
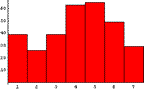
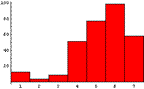
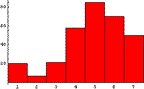
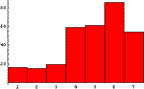
The above numeric information tells almost all of the story about these surveys. Nonetheless, for completeness, here are histograms of the results of the Winter 2005 survey.
 In-Class Questions |
 Small-Group Discussion |
 Demonstrations |
 Flash Animations |
 Pre-Class Quizzes |
 MP Problem Sets |
 Written Homework |
 Tablet PC |
These are conceptual activities done by small groups of students. In the first and second quarters, we used these a fair amount. We discovered that the activities were often too simple for our students. When the level was correct, we believe they were quite effective.
In the third quarter of the course they were not used to a significant degree. In the fourth quarter, there were no available tutorials on the topics of the class so the workbooks were not used at all. Thus we did not ask this question in the Winter 2005 survey.
With the exception of the third quarter, the Tablet PC is used as an electronic blackboard projected onto the main screen in Con Hall. In the third quarter, the classes were PowerPoint-like with the Tablet PC being used to annotate the slides of the presentation.
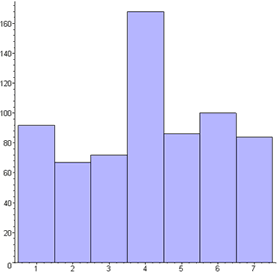
In the first survey the question that we asked was: Instead of PowerPoint, the main content of the classes was delivered using the Journal program on a Tablet PC. Compared to a PowerPoint-based class like BIO150, how effective is this technology for your education? It is not clear to me what we were asking in this mal-formed question, and I wrote it! A histogram of answers appears to the right. With the exception of the neutral answer 4 the shape is essentially flat. |
|
For the second survey the question was changed to:
The main content of the classes was delivered using the Journal program on a Tablet PC, with some PowerPoint slides and other information on the side screens. How effective was the use of the Tablet PC for your education?