The quizzes have been marked. You may determine your mark either
via STORM at:
http://www.storm.utoronto.ca/PHY138Y1Y/student/
or in hardcopy form on the course bulletin board. The bulletin board is located
on the West wall of the first floor of the North Wing of McLennan.
Report any problems with your quiz mark
to Dr. Savaria in MP901A immediately. |
| You may see the three different quizzes, including the answers, with the links to the right. All are in pdf format. |
We were very pleased with the results of the quiz. Here are some statistics:
Wednesday |
|
||||||
Thursday |
|
||||||
Friday |
|
The results for the Wednesday and Friday tutorial quizzes are somewhat higher than we expected, which makes us happy. However, the Thursday marks are very very high. This is because Dr. Savaria, Professor Key and I all thought that Question 6 on that quiz would be much harder than it turned out to be.
Obviously, we have had to adjust the quiz marks so that the overall distributions, averages, etc. are the same for all three versions. Thus we have raised the marks for the Wednesday and Friday tutorials.
The marks for the Thursday quiz have not been adjusted.
| These adjusted marks are the ones that will count towards your final mark in PHY138. They are the ones recorded in STORM. |
The remainder of this section discusses the details of how the adjustment was done.
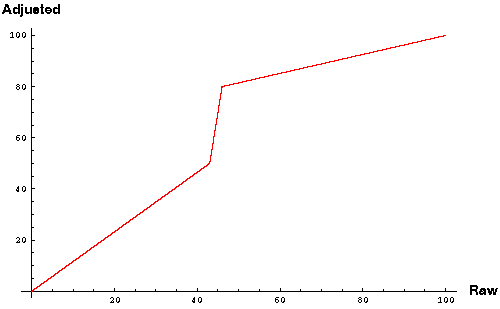
We define "breakpoints", which are raw marks that will be mapped into the adjusted marks. Raw marks between the breakpoints are scaled linearly. Here are the breakpoints that we used:
| Wednesday Raw Mark |
Friday Raw Mark |
Mapped To: |
|---|---|---|
0 |
0 |
0 |
42 |
43 |
50 |
43 |
44 |
60 |
44 |
45 |
70 |
45 |
46 |
80 |
100 |
100 |
100 |
The figure to the right indicates the mapping from Raw to Adjusted marks. Although the mapping is somewhat different for the Wednesday and Friday quizzes, the graphs look almost identical. |
 |
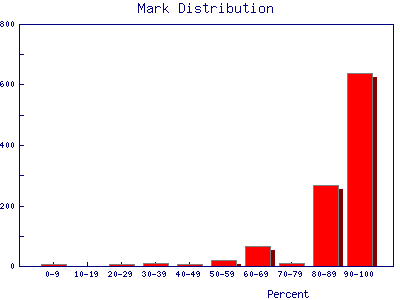
After adjustment, here is some information on the quiz marks. The differences between the three quizzes are as negligible as we could make them.
|
 |
The main purposes for giving the quizzes were to:
The fact that, with the exception of the surprisingly easy question on the Thursday quiz, students did somewhat better than we had anticipated pleases us.
You should be aware, however, that on the Test we will be trying to achieve a more "normal" grade distribution. The definition of a normal grade distribution at the University of Toronto has: