The Lens Optics Experiment
 Although by the first century of the current era the Romans knew how to use
globes of water as a simple magnifying glass, the first known scientific study
of lens optics was the Kitab-al-Manadhir (Opticae Thesaurus)
by Abu Ali al-Hasan Ibn al-Haytham (Alhazen) around 1000 A.D.
This document introduces the Lens Optics experiment from
the Physics laboratories at the University of Toronto. It should be used before
you begin to work on the experiment.
The Preparatory Questions at the end of this document should
be answered and turned in to your Demonstrator before you begin to work on the
experiment.

Requirements
In order to effectively use this page, your browser needs to be capable of
viewing Flash animations, also known as swf files. The Flash
player is available free from http://www.macromedia.com/. The
animations are for Version 5 of the player or later.
You will also want to have either the Real Media or QuickTime video player
installed on your computer. The Real Media player is available free from http://www.realnetworks.com/.
The QuickTime player is available free from http://www.apple.com/quicktime/.
We have also prepared a document of the soundtrack of the video and a summary
of the information in this page. For most people, effectively using these will
mean having them in hard-copy instead of reading them on-screen. Thus, they
are prepared in pdf format. Accessing this guide will require that you
have the Acrobat Reader, which is available free from http://www.adobe.com

Introduction
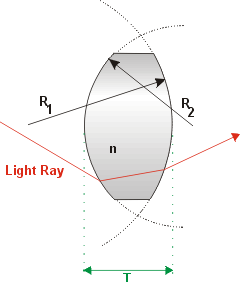
A lens is an object made of a material that refracts
light rays; that material is characterised by an index of refraction
n. Typically, the surfaces of the lens are concave or
convex, and are characterised by radii of curvature Ri.
The figure to the right shows a generic lens of thickness T.
Both surfaces of this lens are convex.
A thin lens is defined as one with equal radii of curvature
and whose thickness T is small compared to the radii
of curvature. |
 |
|
|
Thin lenses have two properties, from which all the others follow
from simple geometry:
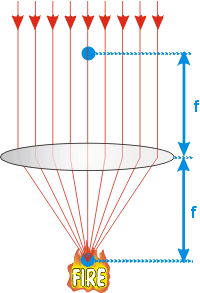
Property 1: All light rays that enter the lens parallel
to its axis converge to a single point, called the focal point
of the lens. You may have observed this if you have used a magnifying
glass to set small pieces of paper or leaves on fire with light from the
sun: the light rays from the sun are essentially parallel and all converge
to one point where their energy is concentrated. It turns out that thin
lenses have two focal points an equal distance away from the centre of
the lens. The distance from the lens to the focal point is called the
focal length f. The figure to the right illustrates.
This convergence is of all light rays at a single point is not quite
exact.
Also, the focal length is a function of the index of refraction of the
material of the lens. Since the index of refraction is usually a function
of the wavelength of the light, this means that the focal length also
depends on the wavelength. |
 |
|
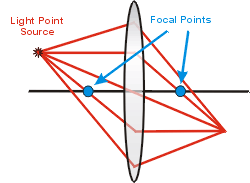
| Property 2:. All light rays emitted
from a point source that enter the lens converge to a single
point. The figure to the right shows this.
You may wish to note that:
- The ray from the source that enters the lens parallel to its axis
goes through the right-hand focal point.
- The ray from the source that goes through the left-hand focal point
emerges parallel to the lens axis.
- The ray from the source that goes through the center of the lens is
not refracted.
Note that the remark about the ray that goes through the center of the
lens above is only approximately true. |
 |
|
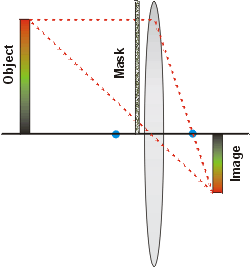
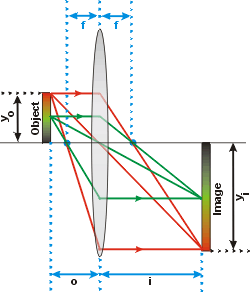
These two properties of a thin lens means that if we
have an Object to the left of the lens and outside of the focal
point, all light rays from each point on the Object converge to form an
Image to the right of the lens. This is shown in the figure to
the right.
The figure shows three of the light rays leaving the top red part of
the Object and converging to form the Image. It also shows three light
rays leaving the middle green part of the Object to converge at the image.
Of course, all light rays from each point on the Object converge
at the corresponding point on the Image.
If we place a white screen at the position of the Image we will be able
to see the Image on the screen. Such an Image is called real.
Note that it is upside down relative to the Object.
The distance from the Object to the centre of the lens is o,
and the distance from the centre of the lens to the Image is i. |
 |
An enlarged version of the above figure may be accessed by clicking
on the yellow button to the right. The figure will appear in a separate
window and has a file size of 20k. It is 500 by 584 pixels, so should
print nicely in portrait mode if you wish. |
 |
|
A Flash animation of the formation of the Image when the distance from
the Object to the lens changes may be accessed by clicking on the blue
button to the right. The animation will appear in a separate window, and
has a file size of 16k. |
 |
In the animation you can see that as the distance from the Object
to the lens, o, changes, so does the distance, i,
to the Image. You can also see that as o changes the height
of the Image does too. From plane geometry and the two properties of thin lenses
it is fairly simple to show that:
| |
1 / f = 1 / o + 1 / i |
(1) |
The power P of a lens is one over the
focal length, 1 / f, and is given in diopters. For
example, if a lens has a focal length of 0.4 m, its power is 2.5 diopters. A
smaller focal length is a more powerful lens.
If yo is the height of the Object
and yi the height of the Image, then the magnification
M of the lens is:
| M = |
yi / yo |
|
| = |
- i / o |
|
| = |
1 / (1 - o / f ) |
(2) |
where by convention y is positive if the Object
or Image is pointing up and negative if it is upside down. Equation 2 also follows
from plane geometry.
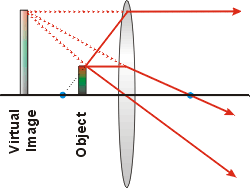
A real image cannot occur if the Object's distance from the lens
is less than the focal length, o < f. In
this case, from Equation 1 the distance to the Image i is a
negative number, which means that it is formed to the left of the lens. Such
images are called virtual and can not be displayed on a screen. They
can be seen with the naked eye, and this is typically how a magnifying glass
is used.
In the figure to the right we have shown three rays from the top of
an Object that is inside the focal point. One ray follows the line from
the left-hand focal point to the lens, so it emerges parallel to the lens
axis. A second enters the lens parallel to the axis, so it goes through
the right-hand focal point. The third goes through the center of the lens
without being refracted.
When all three rays emerge from the lens they appear to have all come
from the top of the Virtual Image. In fact, all light rays from
that point on the Object appear to be coming from the top of the Virtual
Image. If you are to the right of the lens and looking through it, you
will see the virtual image. |
 |
As stated, deriving Equation 1 involves the 2 properties of
thin lenses and using plane geometry. The derivation is an example of theoretical
physics, which is what you are learning in the lecture component of the
course. In the laboratory we are teaching experimental physics. Thus
the derivation is not a required part of the experiment.

The Apparatus
In order to perform the experiment you will need to know how to use
a vernier caliper. An introduction to this instrument may be
accessed by clicking on the green button to the right. It will appear
in a separate window, and has a file size of 56k. You should have your
browser enabled for Java to effectively use this introduction. |
 |
We have prepared a video in various formats to introduce you to
the apparatus for the experiment; the running time of the video is about 4:35
minutes. Links to the video appear below. You will wish to adjust the volume
of the speakers on your computer so that you can easily hear the soundtrack.
For the higher resolution RealMedia version, you may also wish
to increase the size of the video using the controls provided by the player.
| You may download a pdf version of the soundtrack
of the video by clicking on the orange button to the right. It will appear
in a separate window, and has a file size of 12k. |
 |
The Streaming video will be played by the RealMedia
player as it is delivered to your computer by the network. The Download
versions of the video will be downloaded to a temporary area on your local hard
disc and then shown if your browser is configured to use the appropriate player.
You may save these Download versions to a more permanent place that
you specify on your computer's discs by right clicking on the link and then
saving the Target (Internet Explorer) or Link
(Netscape).
 RealMedia Streaming
 |
 |
 RealMedia Download
 |
|
 Quicktime
Download Quicktime
Download |
|
An animation of the effect of moving the image screen has been prepared.
You may access it by clicking on the blue button to the right. It will
appear in a separate window, and has a file size of 14k. |
 |

The Experiments
Initial Exploration
Suppose the upper half of the lens is blocked out by a
mask constructed of a piece of cardboard held in place with masking
tape. What do you predict will happen to the image?
Check your prediction with the actual apparatus.
Is your prediction correct? If not, can you explain why?
Keep the mask in place; this is to keep the intensity low and be more
gentle to your eyes. Set the equipment up so that you get a good sized
image on the screen; Remove the screen and try to locate the image in
your eye; you will find that you have to move your head back and forth
a bit to find a clear image. Is the position of the image on the screen
at the same place as your eye when the image is focused? Can you explain? |
|
A Scenario
Many of the experiments in the I Year Physics Laboratory can have
multiple scenarios to provide a motivation to the experiment. For example,
you could imagine that the experiment is being done at some point in history
before anything about the result was known. Alternatively, you might approach
the experiment as an exercise to determine how well a particular apparatus can
confirm a particular result. Often there are many different possible scenarios
and we leave it to your imagination to supply one that is most interesting to
you.
We shall supply a scenario for the Lens Optics experiment. We
imagine that you are working for the XYZ Organisation, and the apparatus
that you are using will be used in a production environment of the organisation
by a technician to make measurements of the focal length of a large number of
lenses. The focal lengths will all have values fairly close to the one supplied
with your apparatus. Your job is to design a procedure that provides the best
measurement of the focal lengths of these lenses with the minimum effort by
the technician.
Preliminaries
As discussed in the previous section, you will need to apply correction
factors to your measurements of the positions of the object, lens and image
to determine the distance between the object and the lens and the distance between
the lens and the image. This is because the positions of the mounts holding
the components will in general be offset from the positions of the object, lens
and object, and the offsets will be different for each.
Also, the object-lens distance and the lens-image distance are
both measured from the center of the lens.
Measure the thickness of the lens, being careful not to scratch
its surface.
Use the Aluminum rod, whose length is 20.00 ± 0.01 cm,
and the thickness of the lens to determine these correction factors.
The First Project
Equation 1 above relates the focal length f to
the distance from the object to the center of the lens o and
the distance from the center of the lens to the image i according
to:
The determination of both o and i
depend on:
- The readings on the scale of the optical bench of the position of the lens
holder. The uncertainty in this number is probably just the reading error.
The value of o is the position of the lens holder minus the
position of the object holder plus one of the correction factors. Thus the measurement
of o also depends on:
- The readings on the scale of the optical bench of the position of the object
screen holder. The uncertainty in the number is probably just the reading
error.
- The correction factor that you determined with the 20.00 cm rod.
The value of i is the position of the image holder minus the
position of the lens holder plus the other correction factor. Thus the measurement
of i depends on:
- The readings on the scale of the optical bench of the position of the image
screen holder. The uncertainty in the number is probably just the reading
error.
- The second correction factor that you determined with the 20.00 cm rod.
- How much you can move the image screen holder back and forth on the optical
bench without seeing any appreciable difference in the quality of the image.
The precision in your determination of i probably depends
almost entirely on the last factor above. But, you can readily demonstrate that
the amount of this "wiggle factor" depends on whether i
is large or small. One may determine the focal length with: a large value of
o and a small value of i; a small value of
o and a large value of i; or medium values
of both. Thus the precision in your determination of the focal length of the
lens may depend on which of these three alternatives procedures is used.
You are to determine which of the three possible procedures give the best value
of the focal length of the lens.
Caution: a glance at the formula above relating f
to o and i should make it obvious that both
o and i must be greater than f
to have positive object and image distances. So there are constraints on these
distances. You may be able to think of further constraints.
In order to make the technician's measurement as simple and fast as possible,
assume that the position of the object screen and lens holder are fixed. Thus
the technician mounts the lens and moves the image screen to the position of
the best focus and reads the position of the image screen holder.
Assume the radii of curvature of the front and back lens surfaces, R1
and R2, are the same for all the lenses that will
be measured. Does the value of the focal length depend on the thickness of the
lens?
Present the final formula, suitable for putting into a simple computer program,
in which the inputs are the reading of the position of the image screen and
perhaps the thickness of the lens; the output is the value of the focal length
of the lens. Assume that the technician's vision is about as good as yours,
so the uncertainty in i for the technician's measurements is
about the same as yours. What is going to be the final uncertainty in the technician's
measurement of the focal length?
Second Project
As mentioned in the Introduction, often the focal length f
of a lens depends on the wavelength  of the light. Thus, if white light is incident on the lens, the different colors
will be focused at different positions. This is called chromatic aberration.
Now your supervisor at XYX Organisation wants you to see whether this
phenomenon is measurable with your apparatus and lens. You are supplied with
color filters which mount on the light source behind the object. The effective
maximum transmission of the filters are at:
- Red: 690nm.
- Green: 530 nm.
- Blue: 420 nm.
What is your report to your supervisor?
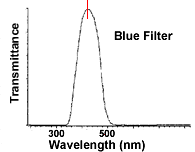
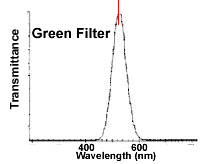
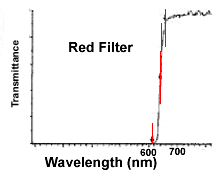
Filter Transmission
For reference, here are the transmittances of the filters you will use in the
Second Project.
|
|
|
Marker at 420 nm |
Marker at 524 nm |
Markers at 612, 640 and 656 nm |

Preparatory Questions
We hope that the following questions will guide
you in your preparation for the experiment you are about to perform. They are
not meant to be particularly testing, nor do they contain any "tricks".
Once you have answered them, you should be in a good position to begin the experiment.
- The relation between focal length f, object distance o,
and image distance i is:
1 / f = 1 / o + 1 / i
- Rearrange the equation so that it gives f instead of
one over f as a function of o and i.
- For determining the error in f as a function of the errors
in o and i, this equation is harder to
use than the original one. Why?
- In the discussion of the properties of thin lenses above, we stated that
"The ray from the source that goes through the center of the lens is
not refracted." We noted at the time that this was only approximately
true. Why is this only approximately true, and how does the approximation
relate to the word thin?

Summary
| A summary of this document in pdf format has been prepared.
You can print this summary to bring in to the laboratory if you wish. You
may access the summary by clicking on the red button to the right. The file
size is about 21k. |
|

Authors
Earlier versions of this guide sheet have been
by Joe Vise (1985, 1987), Claude Plante (1993), Tony Key (1995), Milton From
(1995), Tony Key (1998) and David M. Harrison (1999)
Thanks to I Year Laboratory student Janet Null,
whose questions in 1999 motivated much of this version.
Thanks to Doug Macintosh, Dept. of Chemistry,
for measuring the transmission of the filters.
This web version is by David M. Harrison, April
2003.
This is $Revision: 0.3 $, $Date: 2003/04/16 14:44:27 $ (y/m/d
UTC).
 Although by the first century of the current era the Romans knew how to use
globes of water as a simple magnifying glass, the first known scientific study
of lens optics was the Kitab-al-Manadhir (Opticae Thesaurus)
by Abu Ali al-Hasan Ibn al-Haytham (Alhazen) around 1000 A.D.


