Prepared by David Harrison, May 8, 2005
As is customary, this report summarises the usage of the undergraduate computing facility in the past academic year.
UPSCALE services can be divided into three main categories:
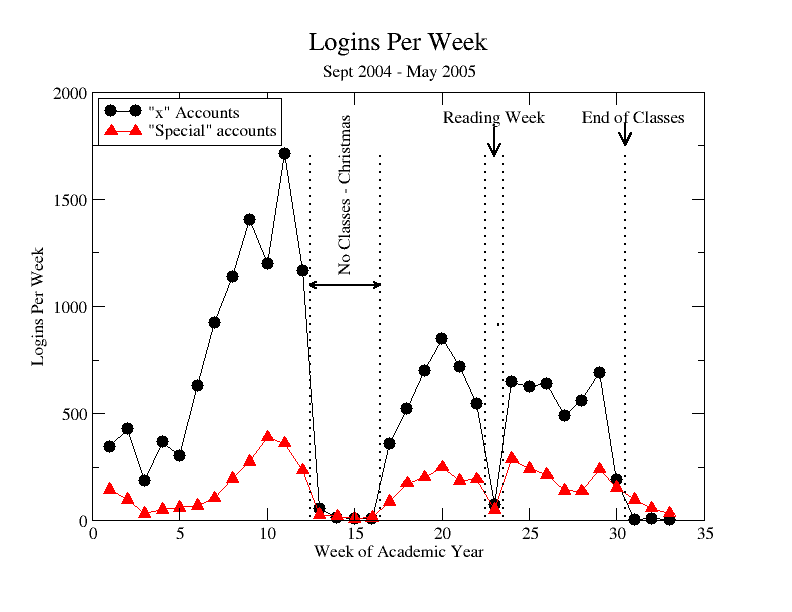
UPSCALE maintains two types of accounts for undergraduate students, offering somewhat different services. The "x" accounts are given to our first and second year students. The "special" accounts are for upper-year students.
Traditional logins are either from our in-house X-terminals or remotely via ssh, ftp or telnet. These are summarised in this section.
The following figure shows the logins per week for the "x" accounts and "special" accounts.
Other aspects of this service are summarised in the following table.
| What | 2004-2005 | 2003-2004 | 2002-2003 | 2001-2002 | 2000-2001 | 1999-2000 | 1998-99 |
| Active "x" accounts | 1914 |
1943 | 1820 | 1533 | 1424 | 1794 | 1940 |
| Active "special" accounts | 156 |
142 | 128 | 109 | 84 | 86 | 116 |
| Total student accounts | 2070 |
2085 | 1948 | 1642 | 1508 | 1880 | 2056 |
| Number of "x" logins | 17,712 |
20,001 | 19,162 | 15,222 | 13,488 | 18,820 | 21,499 |
| Number of "special" logins | 3032 |
3855 | 5381 | 9067 | 6329 | 5119 | 5687 |
| Total logins | 20,744 |
23,856 | 24,543 | 24,289 | 19,817 | 23.939 | 27,186 |
| "x" connect hours | 6932 |
7227 | 8223 | 6373 | 6784 | 8465.8 | 10,246 |
| "special" connect hours | 2364 |
1021 | 1340 | 2290 | 2110 | 1772.6 | 1492 |
| Total connect hours | 9296 |
8,248 | 9563 | 8663 | 8894 | 10,238.4 | 11,738 |
In the following table, the phrase "top-level accesses" means access to the html "home page" for a particular sub-system. Certainly some students have bookmarked pages that are accessed by these "home pages" and jumping directly to these pages is not "top-level".
Note that there is a gap in the table between 1996-97 and 2001-2002. This is because including all years makes the table too wide. 1996 was when UPSCALE first began delivering materials via the web.
| What | 2004-2005 | 2003-2004 | 2002-2003 | 2001-2002 | ... | 1996-97 |
| Html and pdf files delivered | 2,177,431 |
1,835,000 | 1,054,291 | 1,620,413 | ... | NA |
| Files delivered | 8,613,662 |
7,018,000 | 5,028,405 | 5,470,331 | ... | 482,046 |
| Percentage delivered in-house | 5.0% |
6.8% | 10.4% | 8.5% | ... | 36.9% |
| Total Gigabytes delivered | 144.9 |
101.8 | 77.1 | 74.1 | ... | NA |
| UPSCALE top-level accesses | 54,054 |
48,115 | 48,578 | 45,776 | ... | NA |
| PHY110/138 Lab top-level accesses | 7,130 |
11,800 | 6372 | 6547 | ... | NA |
| I Year Laboratory non-core Guide Sheets. | 149,403 |
195,000 | 132,817 | 79,467 | ... | |
| Fits and graphs performed | 113,574 |
119,000 | 108,046 | 73,091 | ... | |
| Physics Virtual Bookshelf top-level accesses | 17,218 |
14,500 | 12,718 | 9189 | ... | |
| Videos (RealMedia and QuickTime) | 7,619 |
20,500 | 2566 | ... | ||
| Flash animations | 423,494 |
250,000 | 62,211 | ... |
In the above, entries marked NA are data that are not available. Blank entries mean that the service being summarised was not part of our web site for those years. Also, the "Percentage delivered in-house" only means via our X-terminals, not via a browser on one of our PCs.
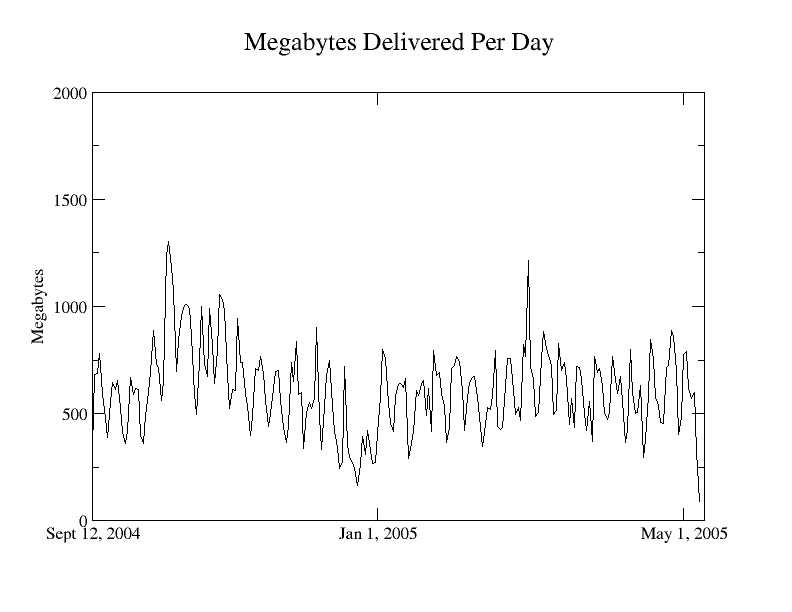
The following figure shows the Megabytes per day delivered by our web server.