An Introduction to Chaos
Click
here
to go to Physics Virtual Bookshelf
Click here to go to the UPSCALE home page.
James Gleick subtitled his popular book Chaos with Making a
New Science. Note the word is "Science," not "Physics." The sub-title is
quite reasonable. However, much of the work on chaotic systems occurs in
Physics departments.
This is a non-technical survey of chaotic systems. It is based on a
one-hour class given largely unchanged to first year undergraduate Physics
students, to upper year liberal arts students, and to upper year Physics majors
and specialists. The emphasis is on the properties that all chaotic systems
exhibit. A secondary emphasis is the fact that most work on these systems is
impossible without computing technology.
The history of the study of chaotic systems exhibits a very common
phenomenon in the sciences. When people began to study the systems we discuss
below, they seemed utterly disorganised. Thus they were called "chaotic." As
work progressed we discovered that hidden in the apparent disorganisation was a
great deal of structure. The structure shared by all of these systems then
became the technical definition of these systems, which we continue to call
"chaotic." So the technical meaning of chaos now means something quite
different from the everyday meaning. Other examples of the same sort of
phenomenon centers around words like energy, momentum, etc.
The Three Body Gravitational Problem
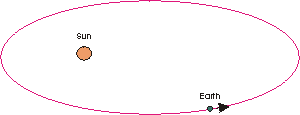 When Newton discovered (or "invented") the Universal
Law of Gravitation, and invented (or "discovered") Newton's Laws of Motion, he
then used these two discoveries to solve the problem of a planet such as the
Earth in orbit around the Sun. Making the simplifying assumption that the Sun
is fixed in space, the solution is that the orbit of the Earth is an
ellipse.
When Newton discovered (or "invented") the Universal
Law of Gravitation, and invented (or "discovered") Newton's Laws of Motion, he
then used these two discoveries to solve the problem of a planet such as the
Earth in orbit around the Sun. Making the simplifying assumption that the Sun
is fixed in space, the solution is that the orbit of the Earth is an
ellipse.
This is a pretty simple problem to solve, and our Physics undergraduate
students do it in their first year. Our Earth's orbit is not as elliptical as
the one shown; it is nearly circular.
A little terminology: we can call the Sun an attractor of the
Earth.
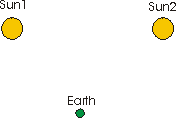 Later, Newton tried to solve
the problem of two "Suns" and a single "Earth." To his surprise, he failed to
find a solution to this second-simplest gravitational system. Through the
years, others tried without success to solve this "three body problem." At one
point a cash reward was offered for its solution: no one ever claimed the
prize.
Later, Newton tried to solve
the problem of two "Suns" and a single "Earth." To his surprise, he failed to
find a solution to this second-simplest gravitational system. Through the
years, others tried without success to solve this "three body problem." At one
point a cash reward was offered for its solution: no one ever claimed the
prize.
By the 1960's, it was realised that even if, for whatever obscure
reason, we were having difficulty in analytically solving this problem, we
could get approximate solutions using computers. The idea is fairly simple:
- We know the position and velocity of the Earth at some time. We can
calculate its acceleration using Newton's Laws.
- That allows us to calculate the new position and new velocity of the
Earth at some time a very very small "time step" later. We calculate its new
acceleration using Newton's Laws.
- We can the calculate the new position and new velocity at a very very
small time later then the time in step 2.
We can continue this as long as we wish. Note that the solutions will
not be perfectly accurate, but if we make the "time step" small enough we can
make them as close to correct as we wish. Note also that in principle these
calculations could be done by hand, but in practice such a scheme is highly
impractical.
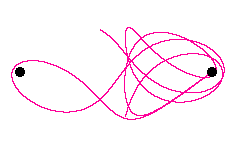
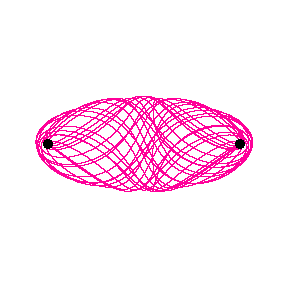 Here is the result of such a calculation. We assume that the "Suns" are
actually point particles so the "Earth" never collides with them. The Earth
starts at a position between the two Suns that is below and slightly to the
right of the midpoint; it is initially slowly moving up and to the right.We
have solved from the initial time 0 to a time 80 units later. Note that being
able to solve this three-body problem analytically would be equivalent to
finding a mathematical expression for this curve; this leads us to suspect,
correctly, that an analytic solution to the problem is not possible. It
is possible to show that the trajectory of the Earth will never repeat
itself even if we let the time go to infinity. This, in turn, leads to the idea
that the trajectory after infinite time is an infinitely long line in a finite
volume. This simple gravitational system is our first example of a
chaotic system.
Here is the result of such a calculation. We assume that the "Suns" are
actually point particles so the "Earth" never collides with them. The Earth
starts at a position between the two Suns that is below and slightly to the
right of the midpoint; it is initially slowly moving up and to the right.We
have solved from the initial time 0 to a time 80 units later. Note that being
able to solve this three-body problem analytically would be equivalent to
finding a mathematical expression for this curve; this leads us to suspect,
correctly, that an analytic solution to the problem is not possible. It
is possible to show that the trajectory of the Earth will never repeat
itself even if we let the time go to infinity. This, in turn, leads to the idea
that the trajectory after infinite time is an infinitely long line in a finite
volume. This simple gravitational system is our first example of a
chaotic system.
You can view an animation of the motion of this "Earth." The animation
will appear in a separate window. To view the animation, click
here
Technical note: the three body problem above was solved in a Hamiltonian
formulation, using Mathematica's NDSolve function. The units
are such that GM = m = 1, and the two Suns are 2 units apart.
It is important to stress that this, and all classical chaotic systems,
is completely deterministic. If we start the Earth with identical position and
velocity, it will follow exactly the same trajectory each and every
time. There are, however, quantum chaotic systems, and quantum systems
are usually considered to be non-deterministic.
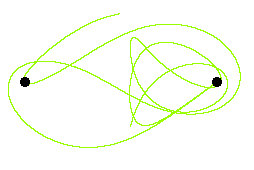
Next, we consider solving the same three body problem that we have just
done with one minor difference. Above the horizontal speed of the Earth at the
beginning was 0.00500. We re-solve with the initial horizontal speed one
percent larger: 0.00505. The initial position and the initial vertical speed
are exactly the same as before. We solve this problem for a final time of 15
units and compare to the previous system with a final time also of 15 units
|
To the right we show two solutions to the three body problem. They
both start from the point that is horizontally about half-way between the two
suns and is below the line connecting the suns. The previous solution that we
have been looking at is the upper (red) trajectory. The lower (green)
trajectory differs only in that its initial horizontal speed is one percent
greater than the upper red one. Looking carefully, we can see that at the
beginning the two trajectories match fairly closely. Later, however, the two
trajectories diverge. We have an animation of the time evolution of these two
trajectories, where the second image is on top of the first one. It shows the
differences between the trajectories much more clearly. Click
here to see the animation.
We also have prepared a Flash animation of this problem. It requires the Flash player of version 6 or better; the player is available free from www.macromedia.com. Click here
to see the animation.
|
|
From the animations, we see that initially the two trajectories are
almost exactly the same; this is what we would expect for non-chaotic systems.
Suddenly, the two trajectories radically diverge. This radical divergence
arising from miniscule differences in the initial conditions is called
Sensitive Dependence on Initial Conditions (SDIC), and is a
characteristic of all chaotic systems. Sometimes it is called the "butterfly
effect" because, if history were chaotic, then whether or not a particular
butterfly landed on a particular flower in the Himalayan mountains in 1837
determined the outcome of World War II.
Many workers in the field take SDIC to be the primary indicator of a
chaotic system. In any case, we shall place it as the first entry in the list
we are building of the properties of all chaotic systems:
- All chaotic systems exhibit Sensitive Dependence on Initial
Conditions.
Above, we saw another phenomenon that turns out to be shared by chaotic
systems.
- For all chaotic systems, the trajectory never repeats.
Here is an example that is much-studied by researchers into chaotic
systems. We imagine a big hopper of sand, and we drop one grain of sand at a
time onto the floor. A sandpile begins to form. The key feature here is that
the height of the sandpile goes up as the number of grains of sand that are
dropped onto it increases. The exact relationship between the height and the
number of grains of sand depends on factors such as how the grains pack
together in the sandpile etc. We call such a situation linear.
In this context, the height does not have to vary directly as the number
of grains of sand. It might go up as the square root of the number of grains,
or the square. The crucial point is that height goes up smoothly with the
number of grains of sand. A colleague, Prof. Jim Drummond, describes a linear
system this way:
"If I kick it, it screams. If I kick it harder, it screams louder."
At some point the sandpile gets so high that when we drop one more grain
of sand onto it, an avalanche occurs and the height of the sandpile is reduced.
There are two things to note about this:
- A small change in the input, one more grain of sand, has caused a
huge change in the output, the height of the sandpile. Thus, the system is
exhibiting Sensitive Dependence on Initial Conditions.
- The system is now nonlinear. The output is not proportional to the
input.
This last point, too, is shared by all chaotic systems. So we have
another entry in our list of properties shared by all chaotic systems.
- All chaotic systems are nonlinear.
We will be adding to this list in subsequent sections.
The Logistic Map
Imagine we are trying to model the population of, say, rabbits in a
forest. We know that, given what rabbits like to do, the increase in population
of rabbits will be related to the number of rabbits that we have. So we expect
a term to look something like:
number(next generation) = L * number(this generation)
Here L is a constant representing the fecundity of the
bunnies.
We also know that when there are too many bunnies in the forest then
lack of food, overcrowding, etc. will suppress the number of bunnies in the
next generation. If at a population of 100,000 all the bunnies die, then
we need a term like:
n(next generation) = 100000 - number(this generation)
Putting these two terms together we get:
number(next generation) =
L * number(this generation) * (100000
- number(this generation))
This equation is called the Logistic equation. It is so
over-simplified that it has nothing to do with the actual dynamics of
how a population of bunnies (or much of anything else) changes. We will see
further examples later of systems that get over-simplified to the point that
they have virtually no physical content, but nonetheless teach us important
lessons about chaotic systems.
|
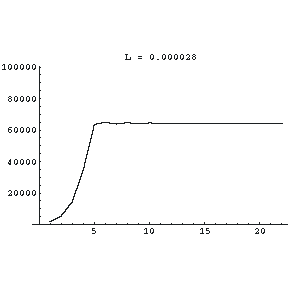
Say we start with two thousand bunnies, and that the constant
L is 0.000028. Then it is simple to calculate that the next generation
will have 0.000028 * 2000 * (100000 - 2000) = 5488 bunnies. The next generation
after that will have 0.000028 * 5488 * (100000 - 5488) = 14523 rabbits, and so
on. We can make a graph of the total number of rabbits in the population. We
see that there are some initial small oscillations, but eventually the
population settles down to a constant value of 64285. |
 |
| |
|
|
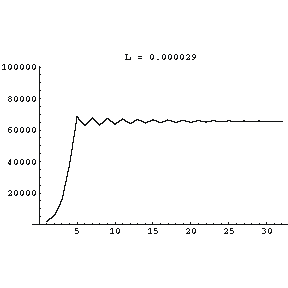
Say we start with two thousand bunnies, and that the constant
L is 0.000029. We see that there are some initial somewhat larger
oscillations, but eventually the population settles down to a constant value of
65,517. So increasing L increases the steady state number of rabbits
in the population.
|
 |
|
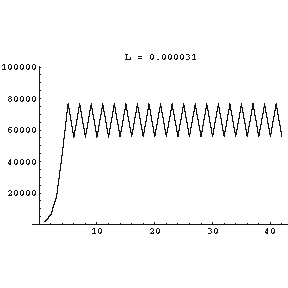
If we increase the fecundity of the rabbits by setting L
to 0.000031, something very interesting happens. The population
bifurcates and in the "steady state" oscillates between two different
values.
Some ecologists now believe that such a "boom-bust" ecological
system is better than a stable one. |
 |
|
Increasing L to 0.000032 increases the size of the swings
in the population. |
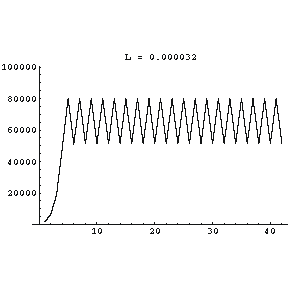 |
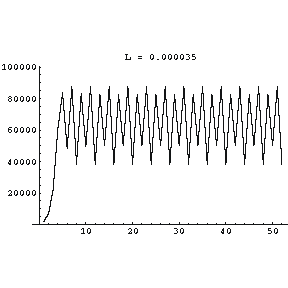
| At L equal to 0.000035 the bifurcated population values
have bifurcated once again, and the number is now oscillating between four
different values! |
 |
|
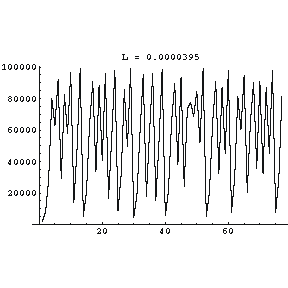
At L equal to 0.0000395 the population values are weird.
In fact, the system has now become chaotic. This means that it exhibits all the
properties of all chaotic systems. For example, a miniscule change in the
initial number of rabbits leads to radical changes in the number of rabbits in
each succeeding generation. It also means that the trajectory shown to the
right never repeats no matter how many generations we calculate in the
graph. |
 |
Technical note: in the numerical examples discussed above, I rounded all
numbers to the nearest integer.
I have written a simple Flash animation to investigate the Logistic Map further. The animation is available here.
To study the map in more detail you may wish to look at a little web-program that I wrote: it is available here.
In addition, John McDonald wrote a Java applet
this also explores the behaviour of this system. There are two sites that I know
of running it:
http://www.geom.umn.edu/~math5337/ds/applets/iteration/Iteration.html
and
http://www.enm.bris.ac.uk/staff/hinke/courses/Chaos/applets/iteration/Iteration.html;
in terms of our discussion, it measures populations in 100 kilo-bunnies with
50,000 rabbits in the first generation.
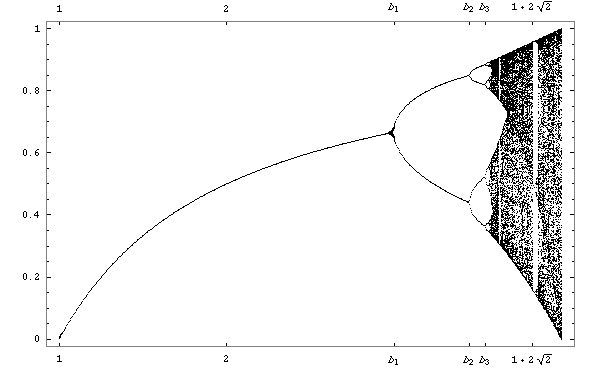
We can calculate the "steady state" values of the population as a
function of the fecundity factor L, and the result of such a
calculation is above. The graph is called the Logistic Map. We see that
initially, as the value of L increases, so does the size of the
population. Then we see the first bifurcation of the population, followed by
the second, and finally the transition to chaos. There are islands of stability
for some higher values of L. We also see a hint in the figure that
after the second bifurcation, yet another bifurcation occurs; this in fact
occurs. If we zoomed in on the region just before the first transition to
chaos, we would see further levels of bifurcation occurring. In fact, it can be
shown that these bifurcations occur to an infinite level. This leads us to our
next indicator of chaotic systems:
- For all chaotic systems, the transition to chaos is preceded by
infinite levels of bifurcation.
Much of the early work on the logistic equations was done by physicist
Mitchell Feigenbaum in the mid-1970's. At this time Feigenbaum's "day job" was
at the Los Alamos National Laboratory. He was using the then-new
Hewlett-Packard HP-65 hand-held programmable calculator to compute when the
next bifurcation in the population would occur as L increased. The
HP-65 was wonderful for its day, but now would be considered suitable only for
use as a paperweight. It was so slow that Feigenbaum had lots of time on his
hands waiting for it to do its calculations. He began trying to guess the value
of L for which the next bifurcation would occur.
This led him to discover that the rate at which the bifurcations were
occurring was governed by a constant number. If, say, L(n) is the
value of L for which the n-th bifurcation occurs, and L(n +
1) is the value where the next bifurcation occurs, then at all levels
L(n + 1) divided by L(n) is always the same value. It turns
out that this number, now called the Feigenbaum number, is irrational
and approximately 4.6692016090... It also turns out that the Feigenbaum number
is associated with all chaotic systems.
- For all chaotic systems, the infinite bifurcations preceding the
transition to chaos are characterised by the Feigenbaum number.
When one is dealing with circles, it is essentially impossible to avoid
having to deal with the irrational number pi, whose value is
approximately 3.1415926... This number seems to be intrinsically associated
with circular systems and/or the way our minds think about them. Similarly,
when one is dealing with systems where the amount of change in some parameter
depends on the value of that parameter, the irrational number e keeps
showing up in, for example, natural logarithms or exponential growth or decay.
So e, whose value is approximately 2.71828..., is somehow associated
with these systems and/or the way our minds think about them. These two numbers
are pretty mysterious, although many of us have gotten used to dealing with
them. Now we seem to have a third such number, this time associated with all
chaotic systems: the Feigenbaum number.
The Lorenz Attractor
In the early 1960's Edward Lorenz was modelling weather systems at
M.I.T. He developed a set of equations that might describe turbulence in the
upper atmosphere, but to his surprise could not succeed in solving the
equations. He began simplifying the equations, until he finally ended up with a
set of equations that no longer had any possible relevance to the problem of
turbulence. Just for reference, here are those equations:
dx/dt = s * (x - y)
dy/dt = -x*z - y + r * x
dz/dt = x * y -
b * x
Here x, y and z are variables and we will
think of t as being the time; s, r and b
are constants.
 Lorenz couldn't solve these simple equations either. However, the
equations can be approximately solved with a computer using exactly the same
technique we discussed above for the three body gravitational problem. The
result of such a calculation giving the trajectory {x,y,z} as time evolves is
shown to the right.
Lorenz couldn't solve these simple equations either. However, the
equations can be approximately solved with a computer using exactly the same
technique we discussed above for the three body gravitational problem. The
result of such a calculation giving the trajectory {x,y,z} as time evolves is
shown to the right.
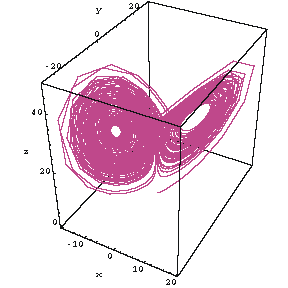
We see that this "attractor" has two points that attract the trajectory.
This is similar to the three body gravitational problem we looked at above. In
the early days of studying this Lorenz attractor everything about it
seemed strange; thus it is sometimes called the strange attractor. Now,
we know that although it is strange, the many many chaotic systems that have
been discovered are similarly strange.
This is yet another chaotic system, and thus has all the properties of
such systems. We have a simple animation of this solution in which we rotate the
trajectory; it shows the "three dimensional" nature of the trajectory more
clearly. To see the animation click here.
We have also prepared a Flash animation which allows you to use the mouse to change the view of the attractor. It requires the Flash player of version 6 or better, and the file size is 550k. It will appear in a separate window. To view the animation click here
.
We see that the trajectory around each attractor is approximately in a
plane. The two planes about the two attractors are almost but not quite in the
same plane. In fact, we describe the dimensionality of the Lorenz
attractor as being just a bit larger than two. This non-integer or fractional
dimensionality turns out to be another characteristic of chaotic systems.
Sometimes such objects are sometimes called fractals.
- All chaotic systems exhibit fractional dimensionality.
Technical note: the above solution to the Lorenz equations had initial
positions of x = 0, y = 1 and z = 0. The constants
were r = 28, s = 10, and b = 8/3. The time
t goes from 0 to 2048. Not all solutions of the Lorenz equations are
chaotic; the crucial factor is the value of the constant r.
I have already mentioned that this document is based on a one hour class
given essentially unchanged to undergraduates at a variety of levels. The
remainder of this section is a little more technical than the rest, and for
some contexts I instead expand on the idea of fractional dimensionality. A
brief document outlining that presentation is available in html
here and in pdf here.
All versions of the class end with the Further Discussion and
Conclusions section at the end of this document.
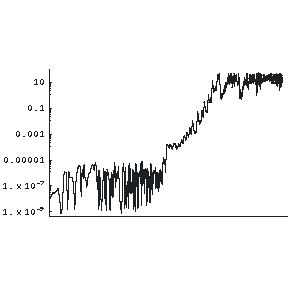 As we have just stated in the technical note, the
above solution was generated with the initial value of y equal to
exactly one. We calculate a second solution with the initial value of
y = 1.000000001. We then make a plot of the distance between these two
trajectories as a function of time; this plot appears to the right.
As we have just stated in the technical note, the
above solution was generated with the initial value of y equal to
exactly one. We calculate a second solution with the initial value of
y = 1.000000001. We then make a plot of the distance between these two
trajectories as a function of time; this plot appears to the right.
We see that, just as for the three body problem, initially the distance
between the two trajectories is fairly small. Then, at some point they diverge
rapidly.
This graph is called a Lyapunov plot. Technically, you may wish
to know that it is a log-log plot.
You can see that when the two trajectories begin to diverge, the
distance between them as a function of time is almost exactly a straight line.
This, too, is a property of all chaotic systems.
- For all chaotic systems, a Lyapunov plot of the distance between
trajectories versus time will exhibit a straight line.
|
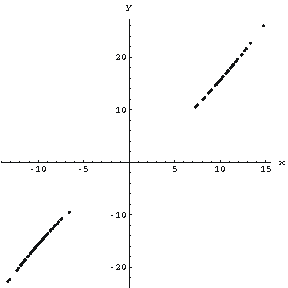
Say we take one of the solutions to the Lorenz equations, and plot
where the trajectory crosses the x-y plane when the value of z is 20 and
increasing. This is called a Poincaré section, and is shown to
the right. The section is a way of analysing complex motion by reducing the
amount of information we need to deal with all at once.
Poincaré introduced this display in the late nineteenth
century while he was working on the three body gravitational problem. |
 |
|
For the Lorenz attractor, all the variables, such as z,
go through maximum and minimum values as the trajectory cycles around the
attractors. We can make a plot of the value of a particular maximum value of
z versus the value of z for its previous maximum. This is
called the first return map and is shown to the right. Also shown is a
dashed line which is at an angle of exactly 45 degrees with the horizontal. We
see that the points in the return map are initially increasing and all lie
above the dashed line. This is yet another characteristic of chaotic
systems. |
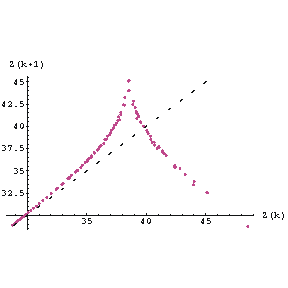 |
- For all chaotic systems, the initial points of the first return
map always lie above a line making an angle of 45 degrees with the
horizontal.
Further Discussion and Conclusions
Above we have discussed three chaotic systems. We now know that there
are many many systems that can become chaotic. A few examples include:
- A pendulum whose support point is oscillating up and down.
- A double pendulum.
- A dripping faucet.
- A billiard ball on a perfectly reflecting billiard table with two
parallel sides connected by two semicircles. This is called a Bunimovich
stadium. A Flash animation of the stadium is available here
For physicists who, like me, were educated in a more-or-less traditional
way, we were tacitly taught that we were going in a straight line from
ignorance to understanding. In retrospect, our path was not even close to
straight, as we had to avoid the swamps and craters of chaos that appear nearly
everywhere we look. Previously we had to avoid those swamps and craters because
they are often not analytically solvable, and solving problems analytically
used to be our only major technique. For some other systems, such as the
logistic equations, solvability is not an issue; the calculational
requirements, however, largely preclude their study with only a pencil and some
paper. Computers have allowed an explosion in our understanding of chaotic
systems in the past 35 years or so.
Virtually alone, in the late nineteenth century Poincaré realised
some of the magnitude of the problems with the three body gravitational
problem, and found some unique and creative ways to nibble around the edges of
the problem. These techniques are still in use today in the study of chaos.
We have discussed some but not all of the properties that all chaotic
systems share. These include:
- Sensitive Dependence on Initial Conditions.
- The trajectory never repeats.
- They are nonlinear.
- The transition to chaos is preceded by infinite levels of
bifurcation.
- The infinite bifurcations preceding the transition to chaos are
characterised by the Feigenbaum number.
- Fractional dimensionality.
- A Lyapunov plot of the distance between trajectories versus time
will exhibit a straight line.
- The initial points of the first return map always lie above a line
making an angle of 45 degrees with the horizontal.
Thus, hidden in the apparent disorganisation is a great deal of
structure.
Lorenz has recently stated that he believes that the weather is a
chaotic system. Since it is virtually impossible to know the initial
conditions, i.e. the temperature, density, wind, humidity, etc., with perfect
accuracy, Sensitive Dependence on Initial Conditions implies that a long-range
weather forecast is impossible in principle. Lorenz speculates that "long
range" here means a week or more.
Earlier I made a brief reference to the fact that most interpretations
of Quantum Mechanics believe that quantum systems are nondeterministic. This
is, of course, where Einstein bailed out on Quantum Mechanics, stating that
"God does not play dice with the universe." Bohr replied to Einstein "Quit
telling God what to do!"
A recent re-interpretation of Quantum Mechanics by David Bohm and his
group introduces the notion of a quantum potential. This potential is
non-local, which accounts for some of the strange "influence at a distance"
that Quantum Mechanics predicts and that has been experimentally confirmed. But
in Bohm's interpretation the motion of objects such as electrons going through
an array of slits is governed by this quantum potential and the trajectory
turns out to be chaotic. Thus to Bohm quantum systems are another deterministic
chaotic system.
Finally, there is a wonderful free program for studying and playing with
chaotic and fractal systems. It is called fractint.You can learn more
about this program at
http://spanky.triumf.ca/www/fractint/fractint.html.
Author
|
This document was written by David M. Harrison, Dept. of Physics.
Univ. of Toronto, mailto:harrison@physics.utoronto.ca,
in December 1998.
The document is Copyright © 1998 - 2002 by David M. Harrison.
This is version 1.26, date (m/d/y) 04/07/06
This material may be distributed only subject to the terms and
conditions set forth in the Open Content License, v1.0 or later (the latest
version is presently available at http://opencontent.org/opl.shtml).
|
|