This document introduces the Torsion Pendulum experiment from the Physics laboratory at the University of Toronto. It is intended to be used before you begin the experiment. The Preparatory Questions at the end of this document should be answered and turned in to your Demonstrator before you begin to work on the experiment.
![]()
In order to effectively use this page, your browser needs to be capable of viewing Flash animations, also known as swf files. The Flash player is available free from http://www.macromedia.com/. The animation is for Version 5 of the player or later.
A summary of this page are also available below. It is in pdf format. Accessing this document will require that you have the Acrobat Reader, which is available free from http://www.adobe.com.
![]()
| |
In the above animation, we see two examples of Simple Harmonic
Motion. On the left a mass hanging from a spring is oscillating vertically;
we call its vertical displacement from its equilibrium position y.
On the right a hollow cylinder hanging from a wire is oscillating in the
horizontal plane; we call its angular displacement from its equilibrium
position |
The system represented by the animation to the right is called a Torsion Pendulum, and will the the subject of this experiment.
If the displacement from equilibrium is r, then the displacement as a function of time t for both these examples is:
| (1) |
where:
r0
the maximum amplitude

/ T
T

For the spring-mass system above, we used the symbol y in
the animation in place of r. For the Torsion Pendulum, we used
![]() in place of r.
The point is that except for the symbols used, the mathematical description
of these two systems are identical.
in place of r.
The point is that except for the symbols used, the mathematical description
of these two systems are identical.
The similarity of the mathematical description of these two systems goes deeper than just Equation 1.
| Spring-Mass System | Torsion Pendulum |
The force F exerted by the spring on the mass is proportional to the displacement x of the mass from the equilibrium position:
where k is a constant for a given massless spring. |
The torque
where |
The period T of the oscillation is given by:
where m is the mass of the object hanging from the spring. |
The period T of the oscillation is given by:
where I is the moment of inertia of the object hanging from the wire. |
Thus the moment of inertia I for the Torsion Pendulum has the same role as the mass m for the spring-mass system.
The period of oscillation for a rotating object, the equation in the lower right of the above table, is:
This can be re-written as:
 |
(2) |
In the experiment you will measure the period T for a number of objects
with different moments of inertia I. Then a plot of T2
versus I should be a straight line with slope 4 ![]() 2
/
2
/ ![]() . Thus, you
may determine
. Thus, you
may determine ![]() for
the wire.
for
the wire.
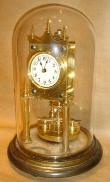
The fact that the period of oscillation of a torsion pendulum is constant for a given moment of inertia and wire is used to build clocks. The clock to the right is a beautiful example. This clock was built in 1880. The photograph is by The Old Father Time Clock Centre, and is used by permission. The original is at http://www.oldfathertime.net/torsion/torsion.html . |
 |
The moment of inertia is a function not only of the mass of the object hanging from the wire but also of how that mass is distributed about the axis of rotation. Some examples are:
Example 1: Two points masses m each a distance r from the axis of oscillation, connected by a massless rod.
|
|
||
Example 2: A disc of mass M, radius r and thickness t oscillating around the diameter that goes through the center of mass.
|
|
||
Example 3: The same disc as before, but oscillating around the perpendicular to its face through the center.
|
|
||
Example 4: A cylinder of mass M, radius r and length t.
|
Note: this is the same result as Example 2 above. |
||
Example 5: A hollow cylinder of mass M, length L, inner radius a and outer radius b.
|
|
Deriving these examples requires knowing that the moment of inertia of a differential mass dm rotating at a distance r from the axis of rotation has a differential moment of inertia dI = r2 dm. Then one integrates all the differential masses over the entire body to calculate the total moment of inertia. This sort of mathematical manipulation, which is an example of theoretical physics, is not part of this experiment, which is teaching experimental physics.
To the right we show the cylinders from Examples 4 and 5 combined into a single complex object. The total moment of inertia is just the sum of those two examples:
|
|
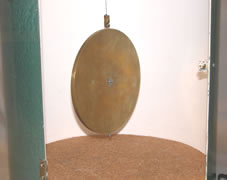
The photograph to the right shows the apparatus for the experiment. The wire is mounted at the top, and hangs down into the chamber. We show a brass disc hanging from the wire. Its orientation is the same as Example 3 in the Introduction. You will measure different objects' period of oscillation with the supplied stopwatch. Barely visible in the photograph is a plexiglas door, which is open in the picture. You will close it before taking data so that air currents do not disturb the motion of the object.
|
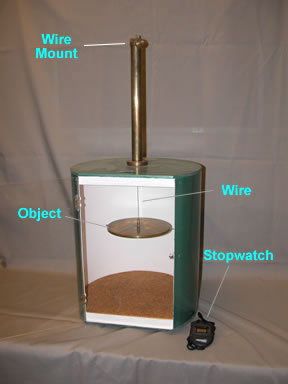 |
You will measure the period of oscillation for 4 different moments of inertia. The above photograph shows the brass disc oriented for one of the moments of inertia you will measure. Here are the other 3 moments you will use:
 |
 |
 |
|
The disc hanging from the wire in another orientation. This corresponds to Example 2 above. |
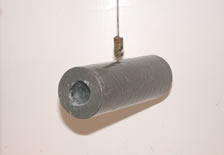
A hollow cylinder. Its moment of inertia is given by Example 5. |
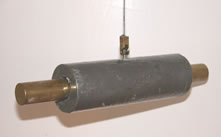
The same hollow cylinder and a solid brass rod. This corresponds to Examples 4 and 5, whose moment of inertia is given above. |
![]()
You will determine the moments of inertia by directly measuring the mass and dimensions of the object. You should use the most appropriate instrument to measure each dimension. Possible instruments include a meter stick, a vernier caliper, and a micrometer.
A document on reading a vernier is available by clicking on the red button to the right. It will appear in a separate window, and has a file size of 56k. You should have your browser enabled for Java to effectively use this introduction. |
|
A document on using a micrometer is available by clicking on the blue button to the right. It will appear in a separate window, and has a file size of 86k. |
You will measure the period of oscillation for each moment of inertia with the stopwatch. A preparatory question below explores the best procedure to use for this measurement.
Although the data collection is simple and straightforward, the analysis of the your results and especially the calculation of the uncertainties in your determinations of the moments of inertia may seem at first to be a bit daunting. A preparatory question below, however, is intended to show you how to make these calculations much simpler than they seem.
![]()
We hope that the following questions will guide you in your preparation for the experiment you are about to perform. They are not meant to be particularly testing, nor do they contain any "tricks". Once you have answered them, you should be in a good position to begin the experiment.
 Two
torsion pendulums are constructed of identical wires except that one wire
is twice as long as the other, as shown. The objects hanging from the wires
have identical moments of inertia. What is the ratio of the period of oscillation
of the two objects:
Two
torsion pendulums are constructed of identical wires except that one wire
is twice as long as the other, as shown. The objects hanging from the wires
have identical moments of inertia. What is the ratio of the period of oscillation
of the two objects:L |
11.72 ± 0.02 cm |
Measured with a meter stick |
2a |
15.4 ± 0.3 mm |
Measured with a vernier caliper |
2b |
34.2 ± 0.3 mm |
Measured with a vernier caliper |
M |
1289.38 ± 0.04 g |
Measured with a balance |
![]()
As promised, we have prepared a summary of the information presented above. It does not attempt to provide a full discussion, but just reviews the "high points" from above.
You may access the summary by clicking on the green button to the right. The summary is in pdf format, will appear in separate window, and has a file size of 47k. You may wish to print this document. |
|
![]()
The photograph of the pendulum clock is Copyright © The Old Father Time Clock Centre 1999-2002, and is used by permission.
All other parts of this document, including all figures, animations and the video, was written by David M. Harrison, Dept. of Physics, Univ. of Toronto, harrison@physics.utoronto.ca in October/November 2002.
Earlier versions of the Guide Sheet were written or revised by Macolm Graham, David M. Harrison, Tony Key, Joe Vise, and others.
This is $Revision: 0.3 $, $Date: 2003/08/07 12:55:00 $ (y/m/d UTC).